EX-99.1
Published on January 26, 2026
Exhibit 99.1

January 26, 2026
Fellow Shareholders,
For the fourth quarter, we recorded net income to common stockholders of $18.4 million, or $0.77 per diluted share. There were some unique items this quarter, which I summarize below as well as covering our core operating metrics. As we enter 2026, our focus is on the operating metrics that demonstrate durable progress including Network growth, revenue and margin expansion, and continued efficiency gains.
CEO Summary of Key Points
•Transportation Revenue Growth & Outlook. Total transportation revenue growth was 4.1% for the quarter. Payments revenue and EBITDA were up marginally. We expect 1Q revenue growth in Payments to exceed 5% and EBITDA margin, ex-LoadPay, to exceed 30% based on contractual agreements with new and existing customers. The outcome of these 1Q projections partly depends on seasonality. Factoring revenue was up 5.8% and core operating margin improved to 32.6%. Intelligence revenue was flat in 4Q, but we contracted over $1 million of additional annualized revenue and the sales pipeline is full.
•Earnings Outlook. Digging below the noise of 4Q, I would estimate that Triumph’s 4Q recurring annualized exit earnings run rate is approximately $1.00 per share. As seasonality in our business is real, this estimate is not a precise prediction of individual quarterly results (especially for 1Q); however, it should give investors a baseline by which to judge core operating performance and growth throughout 2026.
•Network Growth. Our momentum continues and, since our last earnings release, we have added BlueGrace and recently announced signing J.B. Hunt, one of the largest supply chain solutions providers in North America. These new customers will contribute to the revenue ramp and margin expansion throughout 2026. With these additions, Triumph will serve 67 of the top 100 freight brokers and 8 of the top 10.
Events That Impacted Earnings
During the quarter, we had several events that resulted in positive earnings impact for the quarter and reduced ongoing operating expenses.
•Gains on asset sales. We purchased a building in 2024 that we intended to occupy as our future headquarters. The catalyst was the opportunity to consolidate all our Dallas-based operations into a single location. At that time, I wrote in our shareholder letter that I believed we were purchasing the building at an attractive basis. Since then, the Dallas office market has improved, and multiple credible buyers approached us to purchase the building. We had not moved into the building and do not view buildings as strategic assets, so we sold the building for a reasonable profit. Consolidation of our operations can take place in a leased location just as well as an owned one. Along that same theme of monetizing non-strategic assets, we sold an aircraft purchased from a distressed seller during the height of Covid. The disposition of these two assets resulted in a cumulative gain of $14.3 million this quarter. In addition, we expect related annual operating expense savings of $6 million from the disposition of these assets, which was primarily attributable to costs associated with the headquarters building.
•Credit loss expense. We recorded a negative credit loss expense (a net benefit) of $(1.8) million in the quarter. There were notable items going in both directions that impacted that number. On the positive side, we recognized a $9.5 million recovery related to our discounted purchase of a non-performing equipment loan that I wrote about in our 2Q 2025 shareholder letter. On the negative side, we charged off $3.9 million of previously unreserved exposure related to two long-troubled liquid credit loans. One can never be sure, but I fully expect that this is the last time we will need to do this for these specific credits. We are winding down both our liquid credit and asset-based lending (ABL) portfolios, which I explain further in the Banking section.
1
•Other notable items. Here is a summary of other nonrecurring items this quarter that we do not view as part of our run rate. These include:
◦We began deferring a portion of the fees we earn in our transportation insurance agency business, and that adjustment caused a one-time $1.2 million decline in non-interest income in the banking segment.
◦We recorded a $1.2 million impairment of an equity position that we received in a liquid credit loan restructuring, which was a negative adjustment to banking segment non-interest income. The remaining asset on our books is less than $0.1 million.
◦We set aside a $1.1 million litigation reserve related to multiple ongoing, immaterial, ordinary course bank litigation matters.
◦We recorded a $0.8 million expense to true up our self-insured employee health plan, which was spread across all our segments.
Expense Management, Goals for 2026 and The Role of AI in 2026
Expense Management. Our reported expenses for 4Q were $98.1 million, which includes the non-recurring expenses detailed above. Those non-recurring expenses drove the reported number higher than the $96.5 million estimate I gave in our previous quarterly letter. In that letter, I also noted that our drive for efficiency would not end with the $18-20 million in cost savings that we disclosed at that time. By the end of 1Q 2026, we will have reduced our ongoing annual operating expenses by over $30 million. This includes our 3Q 2025 announcements, the savings related to the asset sales discussed earlier in this letter, and other opportunities for improvement we have identified more recently. While a $30 million cumulative expense reduction is worth noting, I want investors to understand that we intend to go further in our efficiency efforts.
Reducing expenses is one lever for us, but it is not our only lever. The better lever is to grow transportation revenue through all the investments we have made and continue to make. Operating both of those levers together–revenue growth and expense discipline–should lead to earnings growth throughout 2026 and beyond. We do not know what the freight market will do, so we focus on what we can control. Our foremost goal is to continue to improve our Network and associated platform offerings so that we delight our customers and help brokers, carriers, factors, and shippers transact more confidently.
2026 Goals…Not Guidance. We have historically limited our guidance to expenses. We expanded things a bit in this letter to give investors a window into 1Q for our segments where we already know about contracted rate adjustments. This is not earnings guidance; however, it is a set of goals related to the important metrics we are monitoring internally.
In last quarter’s call, I spoke about our goal of growing transportation revenue by 20% over the next 4 quarters while exiting 4Q 2026 at a $96.5 million expense base. After delivering over 4% growth in 4Q, we are carrying that objective forward into 2026. Our goal remains to deliver approximately 20% transportation revenue growth while maintaining expense discipline consistent with that $96.5 million quarterly run-rate target exiting 4Q 2026. To support that outcome, we would look for (i) low teens growth in Factoring, (ii) ~25%+ growth in Payments, and (iii) ~50%+ growth in Intelligence revenue exiting 2026. Achieving 20% organic growth at our size is an ambitious target–especially while holding expenses flat–but that is the goal and the plan. Actual results may vary based on market conditions, seasonality, and other factors outside of our control.
If we achieve these growth objectives and keep expenses in line with prior guidance, we will view 2026 to have been a very successful year. If it happens that the uniqueness and density of our Network or market conditions create a breakthrough to earnings that accelerates past these goals, we will not complain about it.
Focusing on these financial goals does not mean that we have abandoned our Network building and improvement efforts. It means that our Network building efforts have reached the point where we are serving our customers with excellence and making our investors happy with improving financial results. I do not take it for granted that many of our investors have stood beside us while we sacrificed near-term earnings in pursuit of long-term value. That is a challenging thing to do as a publicly traded bank. It is now our responsibility to reward that investor patience with consistent, high margin revenue growth and earnings growth.
2
The Role of AI in 2026. The $30 million of expense savings we have already recognized, and the additional savings that are to come, are not just a result of across-the-board expense cuts. We have used and will continue to use artificial intelligence (AI) and machine learning (ML) to run our business more efficiently. We have already leveraged AI solutions to streamline document processing with our audit platforms, enable instant decisioning of invoice purchases, predict lane rates, and improve customer service response times even while generating cost savings. In the upcoming year, we will be deploying new models to further enhance our customer offerings and streamline internal operations. We will continue to be thoughtful about what we disclose publicly, as some capabilities are proprietary. In sum, we believe our data advantage and disciplined execution in this area are becoming a durable source of operating leverage.
Payments
1.Analysis of Financial and Operational Performance for the Quarter
2.Revenue Drivers and Growth Forecast
3.LoadPay Update
4.Additional Segment Financial Analysis
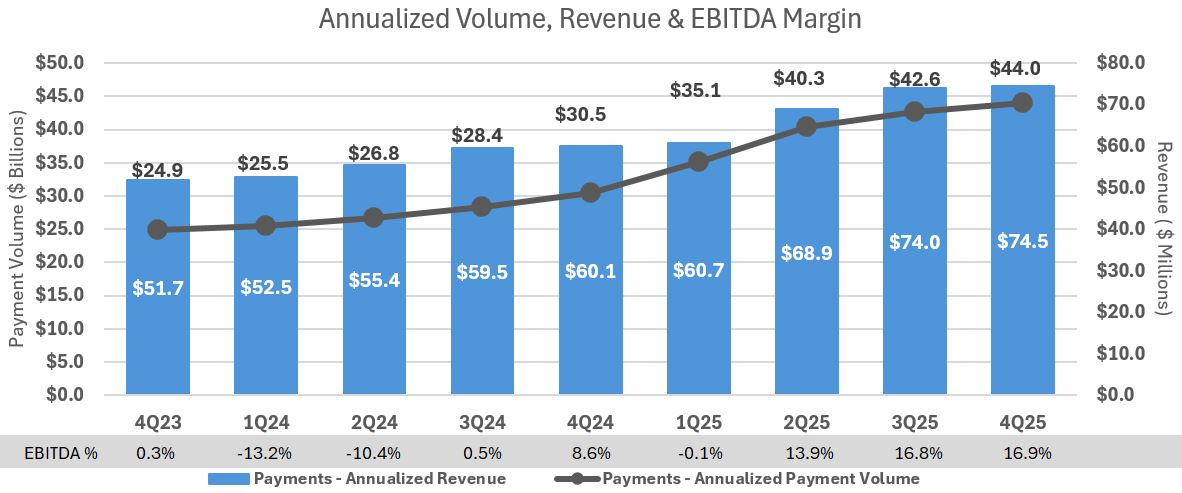
Analysis of Financial and Operational Performance for the Quarter. Revenue grew 0.7% q/o/q to an annualized run rate of $74.5 million. Fee revenue for payments (excluding audit and one-time fees) increased by 10%. EBITDA margin for the quarter improved to 16.9%. Pretax operating income was $0.4 million. Ex-LoadPay, EBITDA margin for the quarter was 29.5% (up 1.3% from 3Q).
| December 31, 2025 | September 30, 2025 | June 30, 2025 | March 31, 2025 | December 31, 2024 | Current Quarter Q/Q | Current Year Y/Y | |||||||||||||||||||||||||||||||||||||||||||||||
| For the Qtr Ending | Change | % Change | Change | % Change | |||||||||||||||||||||||||||||||||||||||||||||||||
| Payments: | |||||||||||||||||||||||||||||||||||||||||||||||||||||
| Invoice Volume | 9,053,274 | 8,826,848 | 8,500,565 | 7,182,044 | 6,788,408 | 226,426 | 2.6 | % | 2,264,866 | 33.4 | % | ||||||||||||||||||||||||||||||||||||||||||
| Payment Volume | $ | 10,995,478,000 | $ | 10,662,418,000 | $ | 10,081,206,000 | $ | 8,777,825,000 | $ | 7,625,735,000 | $ | 333,060,000 | 3.1 | % | $ | 3,369,743,000 | 44.2 | % | |||||||||||||||||||||||||||||||||||
| Network Invoice Volume | 1,090,848 | 1,057,606 | 1,004,603 | 719,531 | 567,258 | 33,242 | 3.1 | % | 523,590 | 92.3 | % | ||||||||||||||||||||||||||||||||||||||||||
| Network Payment Volume | $ | 1,829,509,000 | $ | 1,696,817,000 | $ | 1,579,662,000 | $ | 1,167,464,000 | $ | 922,927,000 | $ | 132,692,000 | 7.8 | % | $ | 906,582,000 | 98.2 | % | |||||||||||||||||||||||||||||||||||
| Average Invoice Price | 1,215 | 1,208 | 1,186 | 1,222 | 1,123 | 7 | 0.6 | % | 92 | 8.2 | % | ||||||||||||||||||||||||||||||||||||||||||
| Network Engagement | 64.2 | % | 63.4 | % | 63.3 | % | 50.4 | % | 48.7 | % | 0.8 | % | 1.3 | % | 15.5 | % | 31.8 | % | |||||||||||||||||||||||||||||||||||
| Average Float | $ | 518,182,000 | $ | 484,582,000 | $ | 469,211,000 | $ | 442,901,000 | $ | 410,044,000 | $ | 33,600,000 | 6.9 | % | $ | 108,138,000 | 26.4 | % | |||||||||||||||||||||||||||||||||||
| Fee Revenue | $ | 8,913,000 | $ | 8,791,000 | $ | 8,105,000 | $ | 6,903,000 | $ | 6,704,000 | $ | 122,000 | 1.4 | % | $ | 2,209,000 | 33.0 | % | |||||||||||||||||||||||||||||||||||
| Total Revenue | $ | 18,628,000 | $ | 18,503,000 | $ | 17,231,000 | $ | 15,184,000 | $ | 15,031,000 | $ | 125,000 | 0.7 | % | $ | 3,597,000 | 23.9 | % | |||||||||||||||||||||||||||||||||||
| # of LoadPay Accounts | 5,892 | 4,421 | 2,367 | 778 | 192 | 1,471 | 33.3 | % | 5,700 | 2968.8 | % | ||||||||||||||||||||||||||||||||||||||||||
| LoadPay Funding | $ | 84,770,000 | $ | 53,042,000 | $ | 22,212,000 | $ | 4,986,000 | $ | 777 | $ | 31,728,000 | 59.8 | % | $ | 83,993,000 | 10809.9 | % | |||||||||||||||||||||||||||||||||||
| Average Interchange Fees | 1.68 | % | 1.64 | % | 1.61 | % | 1.76 | % | 1.67 | % | 0.04 | % | 2.44 | % | 0.01 | % | 0.60 | % | |||||||||||||||||||||||||||||||||||
| EBITDA margin | 16.9 | % | 16.8 | % | 13.9 | % | (0.1) | % | 8.6 | % | 0.1 | % | 0.6 | % | 8.3 | % | 96.5 | % | |||||||||||||||||||||||||||||||||||
For 4Q, both annualized Network engagement[1] breadth and depth were up slightly at $71 billion, and $117 billion, respectively. Payment volume increased by 3.1% to $44.0 billion, annualized. Our broker customers represent $39.3 billion of that. Our average float was $518.2 million for the quarter.
As a reminder, the breadth of the Network represents the percentage of unique brokered freight[2] transactions Triumph has touched at least once regardless of product or segment. The depth of the Network is the dollar volume of all transactions in each product or segment. The depth is larger because we touch certain transactions in multiple products and segments.
Revenue Drivers and Growth Forecast. Revenue growth in our core audit and payments business (ex-LoadPay) will be driven by three levers:
•Winning new relationships: While we already serve 67 of the top 100 brokers and hundreds of smaller brokers, we have an opportunity to serve many more. To that end, we are investing in a variety of innovative marketing and sales efforts to encourage brokers to join us.
3
•Deepening relationships: We have a terrific opportunity to serve existing customers in new ways. For example, only 14% of our Payments and/or Audit customers use our Intelligence offerings. Of our customers that use Payments and/or Audit services, 22% use both Payments and Audit, 50% only use Payments, and 28% only use Audit. We are deepening these customer relationships by integrating and bundling our offerings to deliver more value and a better customer experience.
•Fair, value-based pricing: A lot has changed since we first offered Payments and Audit to the industry. Our product suite is now far more advanced, and the efficiency of the Network for customers is much greater than in the early days. As a result, our efforts to bring all our customers to a fair price that reflects the value of these services have gone well. We have reached agreements with almost all the customers still operating on introductory pricing from years ago. The fees associated with these agreements will phase in over the next four quarters, which will lead to revenue growth and margin expansion.
Collectively, these opportunities represent ~20%+ in core Payments revenue growth over the next year and margin expansion, with all three levers contributing meaningfully in the coming quarters. LoadPay will add additional revenue growth on top of these metrics, which accounts for the ~5% differential from the 25% annual target I gave above for our entire Payments segment.
LoadPay Update. We added about 1,500 LoadPay accounts during the quarter. As of the date of this letter, we have surpassed 6,000 accounts, after having started 2025 with less than 200. We met most of our 2025 goals for new accounts, product fit, and innovation. We have set bigger goals for 2026. As we now have some history on account activity and usage trends, we can also more precisely set KPIs and expectations around monetization. Our goal for 2026 is to triple the revenue in LoadPay from its current run rate.
In 4Q 2025, total revenue in LoadPay contributed about $0.3 million of revenue to the Payments segment, up 58.3% over the prior quarter. We are exiting 2025 with annualized run rate revenue of $1.5 million. LoadPay accounted for $3.0 million of the Payments segment’s expenses, including $0.3 million of software amortization. The sources of LoadPay revenue are fee income (~90%), and float (~10%).
From a unit economic perspective, we are generating about $250 per account annually. If you dig a little deeper, you find that an account linked to either a Triumph Factoring, FaaS or Payments customer currently contributes about $600 in annualized revenue once the account is 90 days old. That revenue per linked account continues to grow with seasoning. This leads us to believe that our original $750 revenue per mature account projection was a good estimate. As a reminder, these accounts take time to season and grow revenue. The revenue comes from changing customer behavior versus lending money to them, which usually starts the full meter at origination. Thus, even though it takes longer to recognize, it is far more capital efficient revenue with almost no associated credit risk. If you take care of those customers and continue to innovate, that revenue begins to look like a fee-based annuity, which is very desirable for us and our investors.
In 4Q, we introduced "Market Lane Rate Data" to carriers within the LoadPay applications. This product brings forward Triumph’s Intelligence data for carriers at the lane level and by equipment type. Inclusion of Market Lane Rate Data, along with our integration to 400+ brokers and Triumph Factoring, is an intentional part of our strategy of differentiating our offering from incumbent banks and potential competitors. LoadPay is far more than a digital bank account.
Additional Segment Financial Analysis. In the chart below, we graphically highlight the continued revenue growth and its trend over the last eight quarters against the backdrop of our payment volumes (note this is Payment volume only, not Network engagement). The bottom line is that we have generated a roughly 20% CAGR in revenue over the last two years despite the longest recession in the history of trucking.
4
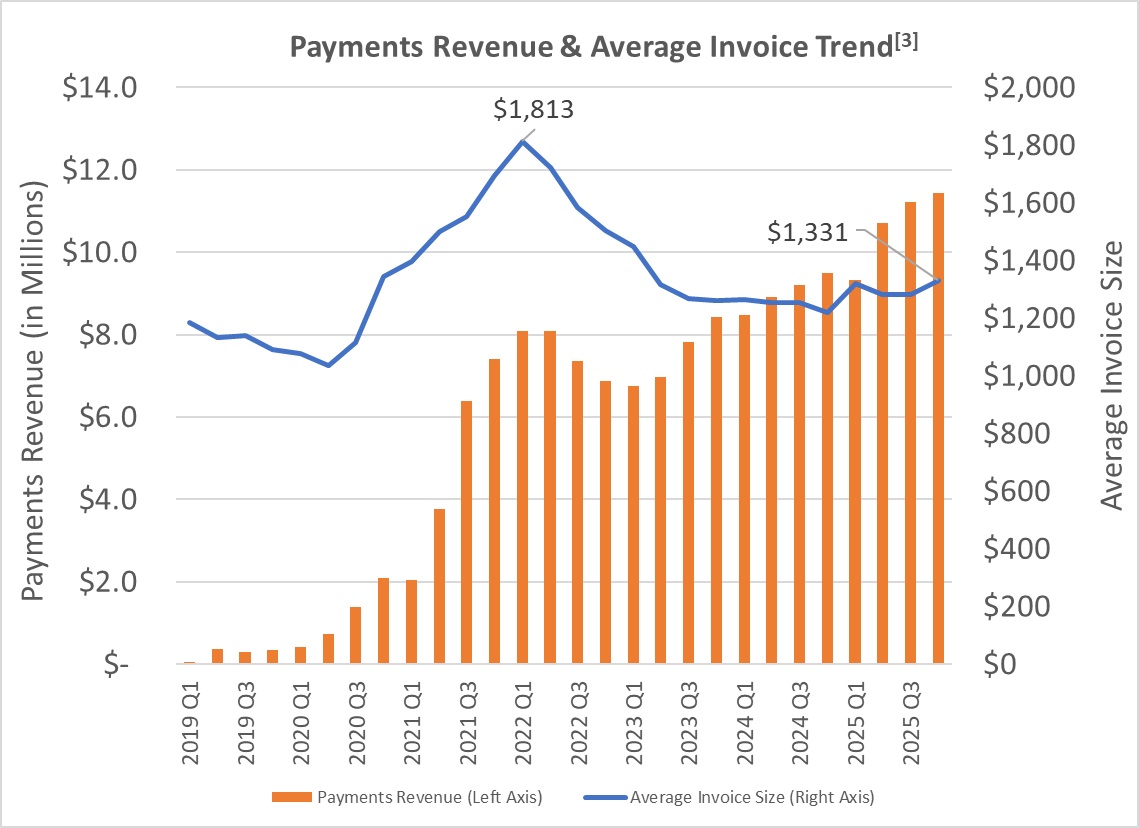
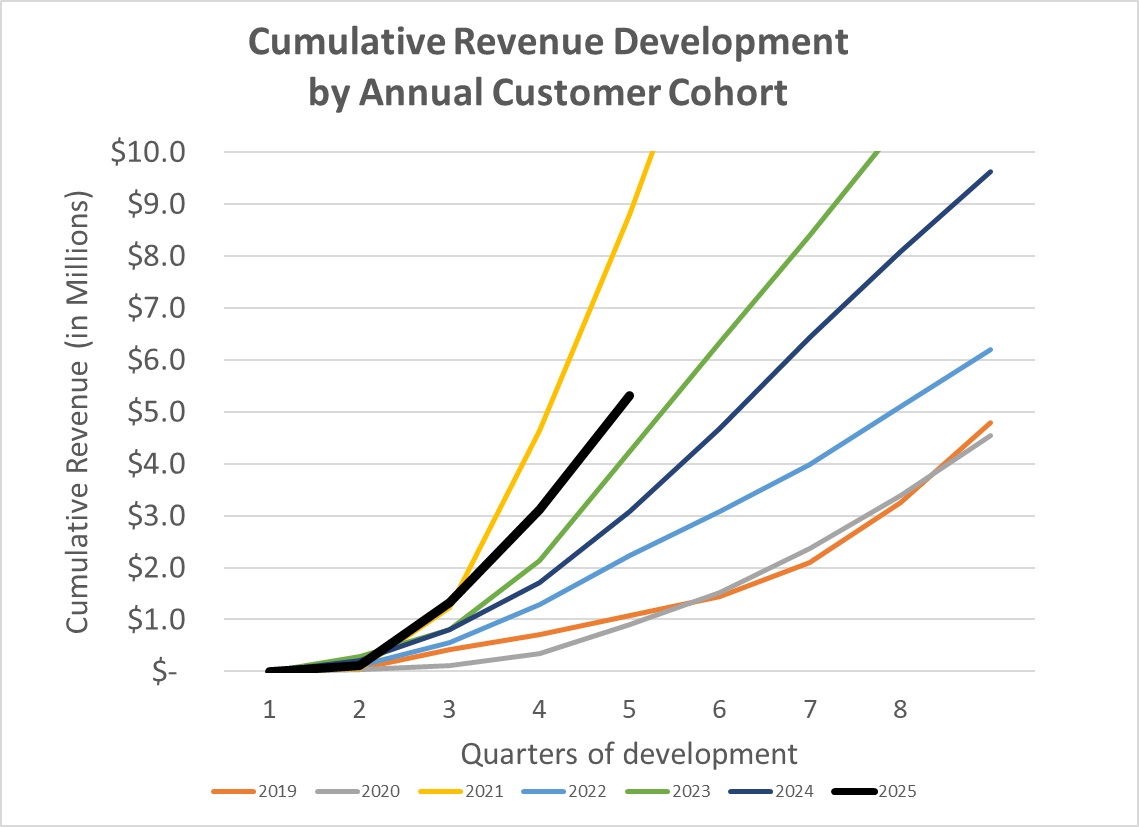
The charts below provide a visual demonstration of how we have increased revenue in our Payments segment to date. The leftmost chart shows Payments revenues have continued to increase despite stable (though unattractive!) average invoice prices over the last three years. On this chart, the line represents invoice sizes[3], while the bars represent revenue. The revenue bars highlight fee income, which can be attributed to a specific customer in a specific year and excludes supply chain finance income and float. Also below, the rightmost chart shows how 2025 Payments customer revenue is outpacing similar cohorts from all prior years (excluding peak 2021). Said differently, we're growing revenue faster from customers added in 2025 than any annual cohort of customer additions since the pandemic. This is black and white evidence of the increasing value of the Network to our customers.
Factoring
1.Analysis of Financial and Operational Performance for the Quarter
2.Automation & AI Update
3.FaaS Update
Analysis of Financial and Operational Performance for the Quarter. The Factoring segment delivered pretax operating income of $13.7 million. Revenue increased 5.8% q/o/q, and pretax operating margin was 32.6%. Aside from the revenue growth, core margin improvement increased due to headcount reduction, enhanced efficiency in our operational processes, and a continued focus on technology improvements. Total purchased volume reached $3.1 billion for the quarter, a 4.1% increase over 3Q, and 13.5% over the same quarter in 2024. Invoice volume increased 0.5% this quarter.
5
| December 31, 2025 | September 30, 2025 | June 30, 2025 | March 31, 2025 | December 31, 2024 | Current Quarter Q/Q | Current Year Y/Y | |||||||||||||||||||||||||||||||||||||||||||||||
| For the Qtr Ending | Change | % Change | Change | % Change | |||||||||||||||||||||||||||||||||||||||||||||||||
| Factoring: | |||||||||||||||||||||||||||||||||||||||||||||||||||||
| Invoice Volume | 1,744,811 | 1,735,860 | 1,697,851 | 1,497,644 | 1,524,904 | 8,951 | 0.5 | % | 219,907 | 14.4 | % | ||||||||||||||||||||||||||||||||||||||||||
| Purchased Volume | $ | 3,119,443,000 | $ | 2,997,895,000 | $ | 2,873,659,000 | $ | 2,707,805,000 | $ | 2,747,351,000 | $ | 121,548,000 | 4.1 | % | $ | 372,092,000 | 13.5 | % | |||||||||||||||||||||||||||||||||||
| Average Transportation Invoice Size | $ | 1,751 | $ | 1,690 | $ | 1,663 | $ | 1,769 | $ | 1,767 | $ | 61 | 3.6 | % | $ | (16) | (0.9) | % | |||||||||||||||||||||||||||||||||||
| Invoices / Client | 241 | 236 | 232 | 204 | 205 | 5 | 2.1 | % | 36 | 17.6 | % | ||||||||||||||||||||||||||||||||||||||||||
| Discount Rate | 1.28 | % | 1.29 | % | 1.37 | % | 1.31 | % | 1.34 | % | (0.01) | % | (0.8) | % | (0.06) | % | (4.5) | % | |||||||||||||||||||||||||||||||||||
| Avg Daily Purchases* | $ | 50,314,000 | $ | 46,842,000 | $ | 45,614,000 | $ | 44,390,000 | $ | 43,609,000 | 3,472,000 | 7.4 | % | 6,705,000 | 15.4 | % | |||||||||||||||||||||||||||||||||||||
| Operating margin | 32.61 | % | 20.71 | % | 48.46 | % | 19.24 | % | 23.67 | % | 11.90 | % | 57.5 | % | 8.94 | % | 37.8 | % | |||||||||||||||||||||||||||||||||||
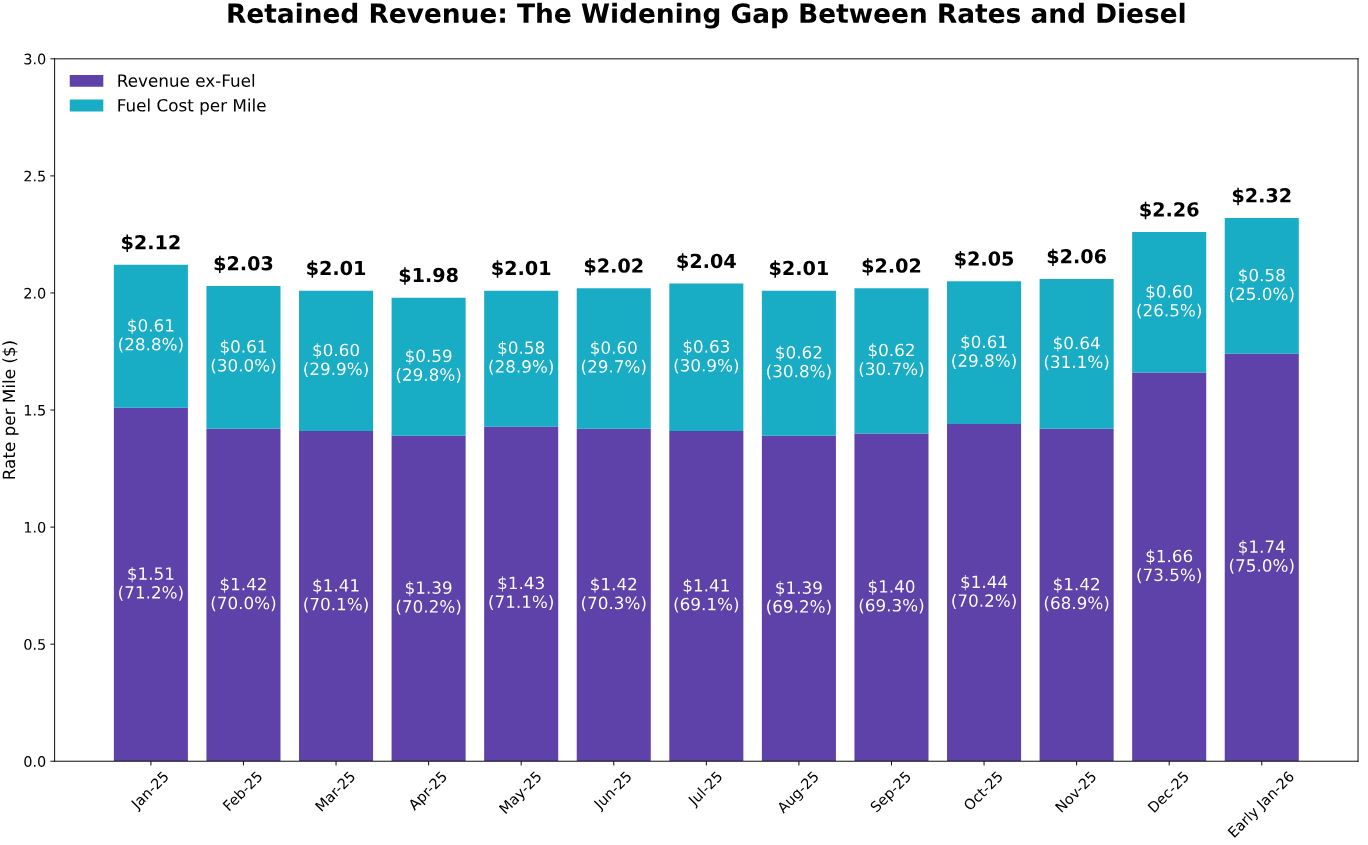
During 4Q, the average transportation invoice was $1,751–up $61 from 3Q, but $16 lower than 4Q 2024. Because we serve two distinct client profiles (fleets and small owner-operators [O/O]), it is useful to view invoice sizes separately. Fleet invoices averaged $1,892, while O/O invoices averaged $1,348. Fleet invoice sizes are ~40% higher than O/O partially because fleets are more likely to operate under contract rates while O/O are usually more exposed to the spot market. There is also a mix difference in the types of lanes that fleets typically run versus O/O, which also affects average invoice size. Compared to 3Q, both segments saw meaningful increases of $69 and $42, respectively. Year-over-year, fleet invoice sizes decreased by $56, while O/O invoices increased by $44. While the invoice size is a key metric for Triumph, it is worth highlighting that that metric can fluctuate for a variety of reasons unrelated to the freight market, including the nature of the freight our fleet clients handle. Our clients transport a wide range of commodities and types of loads, accommodating LTL shipments as well as short regional hauls. These types of loads typically have lower invoice values compared to long-haul or specialized freight, which can affect the overall average.
On a welcome note, for our carrier factoring clients, spot rates have steadily climbed since September, while diesel prices have fallen. Diesel as a percentage of all-in rates have fallen from 30.4% to 26.2% over the quarter. This divergence is a net positive for our carrier clients, who have been suffering through a very difficult market for several years now.
6
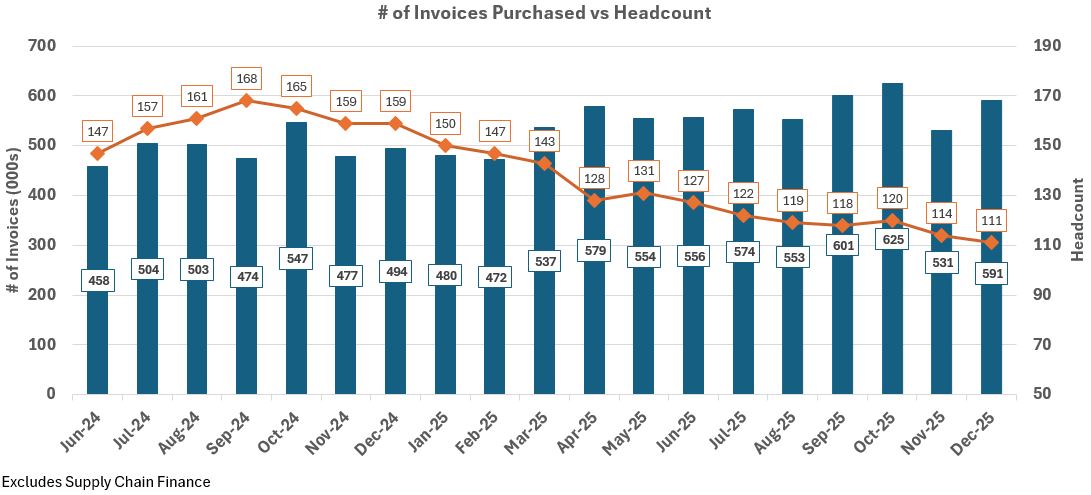
Automation & AI Update. I touched on this briefly above regarding enterprise initiatives, but I will include a few examples here that are germane to our Factoring segment. Our instant decision model continues to drive efficiency in our O/O segment. We are seeing 60%+ of these submitted invoices instantly verified and approved by our AI tools, and 20%+ of them proceed through purchase and funding without a human touching them. This is relatively flat with the prior quarter due in large part to a decision to tighten the automatic controls around this tool. The machines have adjusted, and we expect to continue to see progress and improvement in our touchless processing throughout 2026. Our average time to approve an invoice through these tools is about 12 seconds, with the purchase decision occurring within 23 seconds on average. The product team continues working on improving the model to better support our large fleet operations team, which is currently experiencing a 19% automated approval rate. This is a custom-built, AI driven process that I believe to be unrivaled in the industry (that is an educated guess and largely subjective). What I know for sure is that we will continue to update our AI models to improve performance, reduce friction, and increase margins. As an example of these efficiencies we have already realized, below is a chart that reflects the trend in invoice volume purchased vs operational headcount that supports invoice purchases since the instant decision model launched in June of 2024. Since that date, the number of invoices purchased (point-to-point) has increased 29%, while headcount has decreased 25%. That is largely how we have achieved margin expansion. There is much more to do, and we have several initiatives in flight.
As a final note on this, I would point out that we have primarily used AI to strengthen the pre-purchase side of our business for the past few years. As we close 2025 and move into 2026, our focus has shifted towards automation and AI-driven initiatives to enhance client service and streamline back-office functions in our Factoring segment. This transition includes a deliberate effort to standardize, optimize, and automate where it makes sense, enabling us to continually improve operating margin and reduce our cost to serve.
FaaS Update. Our Factoring-as-a Service (FaaS) initiatives are gaining traction, with 4Q purchase volume growth of 136%. That is not a typo, but I would remind investors that this percentage growth is off a small base. Multiple parties have approached us to explore FaaS for their operations. I expect to have more to say on this in the coming quarters.
Intelligence
1.Analysis of Financial and Operational Performance for the Quarter
2.Partnership with Highway on the Trusted Freight Exchange
Analysis of Financial and Operational Performance for the Quarter. Total revenue was $2.3 million, our average contract value (ACV) was $39 thousand, gross margin was 88%, and we have seen 96% revenue retention since the acquisition. Annualized revenue booked but not realized in 4Q, amounted to $1.0 million. We have integrated Intelligence into our
7
suite of offerings. As a result, we expect to see significant growth in revenue in our Intelligence segment during 2026 as we roll this product out as a reinvented and embedded Triumph offering.
Partnership with Highway on the Trusted Freight Exchange. We expect the growth of the Trusted Freight Exchange (TFX) to be one of the catalysts for growth in our Intelligence segment. Our exclusive partnership with TFX combines the best-of-breed technology from both firms–our Intelligence and Payment capabilities with their secure freight exchange. This combination creates a transparent, trust-driven, transactional load management platform for brokers and carriers.
Freight Market Analysis
Our assessment provides a transaction-backed view into how the truckload market behaved through 2025, grounded in what actually moved through the Triumph Network rather than survey-based proxies. It highlights three things: (i) the sharp compression in broker economics, with median margin falling well below $200 per load across all transport types, (ii) how the late-year spot/contract dislocation translated directly into margin pressure at the load level, and (iii) why emerging policy-driven capacity shocks (especially around Commercial Driver’s License [CDL] enforcement) introduce a new volatility regime that the market is not fully pricing in yet. Together, this perspective links observed rate movement to its direct impact on profitability and competitive positioning, providing a clearer assessment of where pressure is accumulating and what may shape the 2026 freight cycle. This potentially reinforces the view that sustained margin compression and increased volatility could contribute to broker consolidation, particularly as scale becomes an increasing advantage in absorbing risk and operating costs.
The outlook for the 2025 truckload market was defined by optimism. In 2024, people in our industry had the mindset of “stay alive until ’25.” It did not unfold quite like we all expected. The year's events reinforced a crucial lesson: success hinges less on the accuracy of long-term predictions and more on strategic agility. Tariffs upended demand projections and CDL reform added volatility to the supply side. Predicting political and regulatory tail events is hard to do.
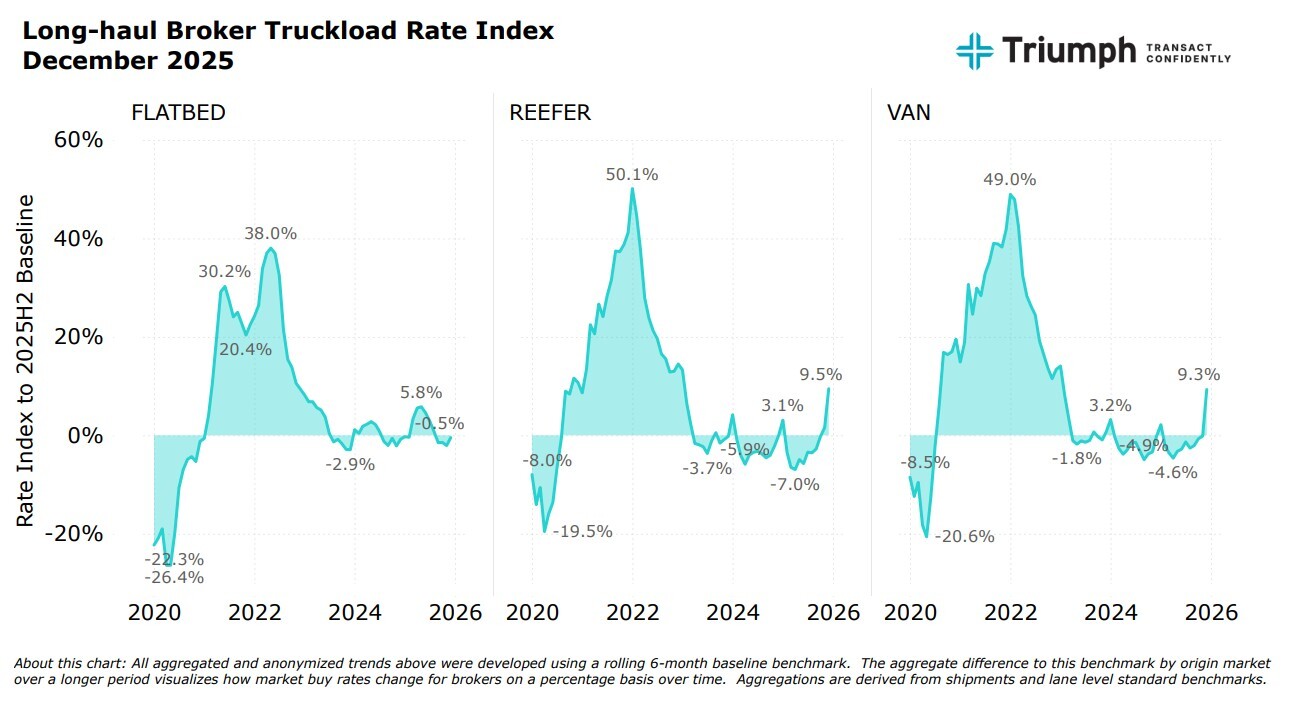
From January to November 2025 the U.S. trucking market largely mirrored the preceding two years defined by repeating seasonal patterns and flat year-over-year rate levels. This stability was influenced by tepid trucking demand against a backdrop of new administrative policies and uncertainties surrounding the aforementioned tariffs and CDL enforcement on an over-supplied base of drivers. However, 2025 concluded with a somewhat anomalous rate spike in December. Many regions exhibited van and reefer rate inflation at levels of 5% to 10% year-over-year. The source for the charts below is Triumph Intelligence.
8
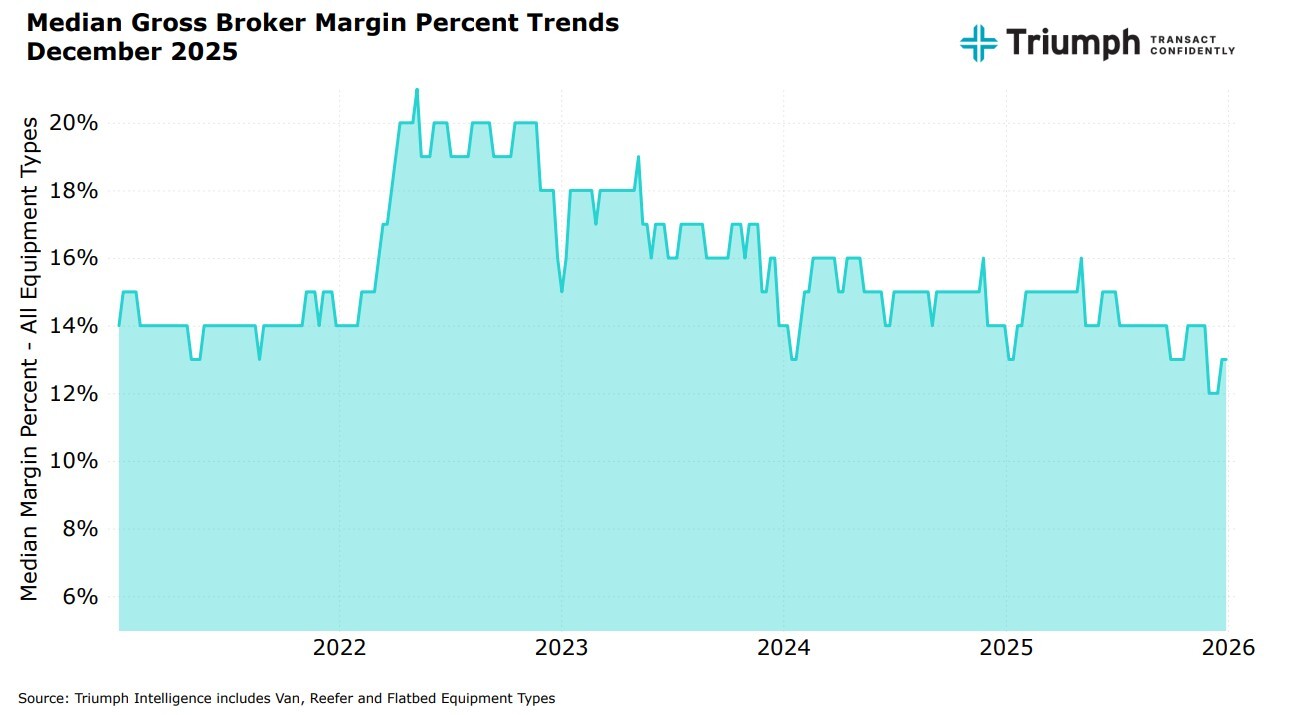
A notable trend throughout 2025 was the continued erosion of broker gross margins across the network, reflected clearly in the percentage decline shown in the chart. After peaking in early 2022, median broker margins gradually compressed over the next several years, with a pronounced step‑down in late 2024 and accelerating pressure through 2025. By December 2025, median gross margins had fallen to some of the lowest levels observed in the past five years. This steady downward movement in percentage margins underscores the challenging market conditions brokers faced throughout 2025.
The 2025 December Anomaly and CDL Enforcement. While tariff related news consumed freight market headlines in the first half of 2025, the non-domiciled CDL regulatory reform usurped the conversation in the back half of 2025. This abrupt federal policy change created something very different for trucking markets–and something we have never witnessed–the uncertainty of price volatility driven by a reduction of tens of thousands of drivers. This reform served as a real-world stress test, proving how quickly a single regulatory decision can upend industry forecasts, and was further exacerbated as it became clear that states would be required to enforce CDL interim rulings or risk losing federal funding. The year ended with an unusual December, which saw measurable month-over-month and year-over-year rate inflation. This inflation, while deviating from the rest of 2025, is mild when compared to pandemic-era levels at 30-50% above current rate levels.
Analysis of a Potential "Market Turn" in 2026
It is said that a broken clock is right twice a day. Despite optimistic end-of-year predictions of a trucking market recovery each of the last three years, it has not come to pass. The strengthening we saw in December 2025 does not, in our opinion, provide sufficient evidence to support the conclusion of a sustained market shift heading into 2026. It is worth noting that December results are impacted by external and seasonal factors including weather, a late Thanksgiving calendar, and the geopolitical scene. It is also worth noting that our YTD metrics in factoring have seen invoices sizes jump to $1,880, which is unusual, but not yet based on enough data to call a trend.
We believe the next quarter will provide an important milestone as to the existence of a market recovery as the Amazon Effect ends over the next few weeks. A great reset in trucking markets may be right in front of us, but because of ongoing and unknown policy changes ahead, it is too early to call. There may be additional policy changes in 2026 to contend with as tariff policy continues to evolve and second and third order effects have yet to mature on current decisions. Whatever the market brings, Triumph will be present and accounted for to help our customers navigate the environment.
9
Banking
1.Analysis of Financial and Operational Performance for the Quarter
2.Update on Credit Metrics
Analysis of Financial and Operational Performance for the Quarter. Banking segment operating income decreased $1.5 million to $25.6 million, or 5.6%, from the prior quarter. Some of this decline was related to lower interest rates, and some was related to the items detailed in the “Events that Impacted Earnings” section above.
While we have previously discussed the negative earnings impact we face in a falling rate environment (if indeed rates fall in 2026, which is not a certainty), we expect another headwind in banking revenue in the coming year. We have begun winding down our ABL and liquid credit portfolios, a process we expect to continue through 2026. Exiting these businesses, especially winding down ABL, will be a marginal drag on earnings. These businesses have each been accretive to our earnings and capital over the long arc of time we have operated them, but they have also added unwanted volatility to our credit metrics and headline noise that distracts from our core transportation strategy.
Update on Credit Metrics. Our credit metrics for the quarter reflect the large recovery on the equipment loan I wrote about in the introduction. The metrics also reflect credit exposure work tied to some of the business lines we are exiting, as well as normal-course credit noise. We continue to monitor the bankruptcy proceedings related to our Tricolor ABL exposure, and we continue to believe that our loan position is adequately secured by inventory and other assets that serve as our collateral.
•Total non-performing loans to total loans: decreased by (0.21)% to 1.15% due primarily to improvements in equipment finance.
•Total classified assets: increased by ~$1.0 million to $187 million or 27% of Tier 1 Capital + ACL.
•Past due to total loans: increased by 0.81% to 2.72% due primarily to one large performing CRE loan that was just over 30 days past due at year-end. We expect to collect the outstanding principal and interest on this loan.
Expense Forecast & Closing Thoughts
We project expenses of $99.0 million for 1Q 2026 due to normal first quarter adjustments. That expense base should taper down throughout the year to our stated goal of $96.5 million by 4Q 2026.
Our plan for 2026 is disciplined execution and steady improvement. Not slow, but not parabolic either. We are building a repeatable trajectory that we believe can compound over time. In the year ahead, we intend to steadily (i) grow earnings, (ii) improve asset quality, (iii) increase our market share by deepening adoption across the Triumph Network, and (iv) improve our value chain. We are grateful for your interest in Triumph and for the trust our investors have placed in us.
With warm regards,
Aaron P. Graft
Founder, Vice Chairman and CEO
10
[1] We define Network engagement as the amount of freight touched through our payments, audit, full AP automation and rate intelligence products. It is an indicator of our broker volume density in the market, the source for growing available Network transactions and data assets, and a key value driver of the Network.
[2] This reference to brokered freight is specific to domestic truckload (TL) freight only. Thus, this calculation would exclude less than truckload (LTL), parcel, etc. It would also exclude shipper volumes. Admittedly, this is a difficult percentage to calculate with precision, and it will move from year to year. That being said, we can evaluate the number of payments received in our factoring segment as a proxy for the percentage of TL freight Triumph Payments is touching and also use industry data points to make informed assumptions. In the end, this goal is not intended to be a precise measurement in the same way as we would measure earnings. It is a directional and blunt measurement of the reach of the Network.
[3] Average invoice sizes in our payments segment are generally smaller than average invoice sizes in our factoring segment as a transportation factor generally will only factor long-haul trucking invoices. Less than truckload (LTL) and parcel typically are not regularly serviced by the transportation factoring industry due to their small ticket size. Our payments business pays all transportation invoices of a freight broker and, as such, includes some LTL, parcel and shorter hauls that a transportation factor normally will not service.
11
Conference Call Information
Aaron P. Graft, Vice Chairman and CEO, and Brad Voss, CFO, will review the financial results in a conference call with investors and analysts beginning at 9:30 a.m. central time on Tuesday, January 27, 2026.
The live video conference may be accessed directly through this link, https://triumph-financial-q4-2025-earnings.open-exchange.net/registration or via the Company's IR website at ir.triumph.io through the Financial Results link. An archive of this video conference will subsequently be available at the same location, referenced above, on the Company’s website.
About Triumph Financial
Triumph Financial, Inc. (NYSE: TFIN) is a financial and technology company focused on payments, factoring, intelligence and banking to modernize and simplify freight transactions. Headquartered in Dallas, Texas, its portfolio of brands includes Triumph, TBK Bank and LoadPay. ir.triumph.io
Forward-Looking Statements
This letter to shareholders contains forward-looking statements. Any statements about our expectations, beliefs, plans, predictions, forecasts, objectives, assumptions or future events or performance are not historical facts and may be forward-looking. You can identify forward-looking statements by the use of forward-looking terminology such as “believes,” “expects,” “could,” “may,” “will,” “should,” “seeks,” “likely,” “intends,” “plans,” “pro forma,” “projects,” “estimates” or “anticipates” or the negative of these words and phrases or similar words or phrases that are predictions of or indicate future events or trends and that do not relate solely to historical matters. You can also identify forward-looking statements by discussions of strategy, plans or intentions. Forward-looking statements involve numerous risks and uncertainties, and you should not rely on them as predictions of future events. Forward-looking statements depend on assumptions, data or methods that may be incorrect or imprecise and we may not be able to realize them. We do not guarantee that the transactions and events described will happen as described (or that they will happen at all). The following factors, among others, could cause actual results and future events to differ materially from those set forth or contemplated in the forward-looking statements: business and economic conditions generally and in the bank and non-bank financial services industries, nationally and within our local market areas; our ability to mitigate our risk exposures; our ability to maintain our historical earnings trends; changes in management personnel; interest rate risk; concentration of our products and services in the transportation industry; credit risk associated with our loan portfolio; lack of seasoning in our loan portfolio; deteriorating asset quality and higher loan charge-offs; time and effort necessary to resolve non-performing assets; inaccuracy of the assumptions and estimates we make in establishing reserves for probable loan losses and other estimates; risks related to the integration of acquired businesses and any future acquisitions; our ability to successfully identify and address the risks associated with our possible future acquisitions, and the risks that our prior and possible future acquisitions make it more difficult for investors to evaluate our business, financial condition and results of operations, and impairs our ability to accurately forecast our future performance; lack of liquidity; fluctuations in the fair value and liquidity of the securities we hold for sale; impairment of investment securities, goodwill, other intangible assets or deferred tax assets; our risk management strategies; environmental liability associated with our lending activities; increased competition in the bank and non-bank financial services industries, nationally, regionally or locally, which may adversely affect pricing and terms; the accuracy of our financial statements and related disclosures; material weaknesses in our internal control over financial reporting; system failures or failures to prevent breaches of our network security; the institution and outcome of litigation and other legal proceedings against us or to which we become subject; changes in carry-forwards of net operating losses; changes in federal tax law or policy; the impact of recent and future legislative and regulatory changes, including changes in banking, securities and tax laws and regulations, such as the Dodd-Frank Act and their application by our regulators as well as privacy, cybersecurity, and artificial intelligence regulation and oversight; governmental monetary and fiscal policies; changes in the scope and cost of FDIC, insurance and other coverages; failure to receive regulatory approval for future acquisitions and increases in our capital requirements.
12
While forward-looking statements reflect our good-faith beliefs, they are not guarantees of future performance. All forward-looking statements are necessarily only estimates of future results. Accordingly, actual results may differ materially from those expressed in or contemplated by the particular forward-looking statement, and, therefore, you are cautioned not to place undue reliance on such statements. Further, any forward-looking statement speaks only as of the date on which it is made, and we undertake no obligation to update any forward-looking statement to reflect events or circumstances after the date on which the statement is made or to reflect the occurrence of unanticipated events or circumstances, except as required by applicable law. For a discussion of such risks and uncertainties, which could cause actual results to differ from those contained in the forward-looking statements, see "Risk Factors" and the forward-looking statement disclosure contained in Triumph Financial’s Annual Report on Form 10-K, filed with the Securities and Exchange Commission on February 11, 2025.
Non-GAAP Financial Measures
This letter to shareholders includes certain non‐GAAP financial measures intended to supplement, not substitute for, comparable GAAP measures. Reconciliations of non‐GAAP financial measures to GAAP financial measures are provided at the end of this letter to shareholders.
13
The following table sets forth key metrics used by Triumph Financial to monitor our operations. Footnotes in this table can be found in our definitions of non-GAAP financial measures at the end of this document.
| As of and for the Three Months Ended | As of and for the Year Ended | ||||||||||||||||||||||||||||||||||||||||
| (Dollars in thousands) | December 31, 2025 | September 30, 2025 | June 30, 2025 | March 31, 2025 | December 31, 2024 | December 31, 2025 | December 31, 2024 | ||||||||||||||||||||||||||||||||||
| Financial Highlights: | |||||||||||||||||||||||||||||||||||||||||
| Total assets | $ | 6,380,588 | $ | 6,357,149 | $ | 6,494,748 | $ | 6,268,394 | $ | 5,948,975 | $ | 6,380,588 | $ | 5,948,975 | |||||||||||||||||||||||||||
| Loans held for investment | $ | 4,991,307 | $ | 4,986,922 | $ | 4,953,170 | $ | 4,666,223 | $ | 4,546,960 | $ | 4,991,307 | $ | 4,546,960 | |||||||||||||||||||||||||||
| Deposits | $ | 4,950,216 | $ | 4,955,246 | $ | 5,186,098 | $ | 4,976,750 | $ | 4,820,820 | $ | 4,950,216 | $ | 4,820,820 | |||||||||||||||||||||||||||
| Net income available to common stockholders | $ | 18,412 | $ | 907 | $ | 3,618 | $ | (784) | $ | 3,036 | $ | 22,153 | $ | 12,884 | |||||||||||||||||||||||||||
| Performance Ratios - Annualized: | |||||||||||||||||||||||||||||||||||||||||
| Return on average assets | 1.18 | % | 0.11 | % | 0.28 | % | — | % | 0.26 | % | 0.40 | % | 0.28 | % | |||||||||||||||||||||||||||
| Return on average total equity | 8.14 | % | 0.73 | % | 1.95 | % | 0.01 | % | 1.70 | % | 2.76 | % | 1.81 | % | |||||||||||||||||||||||||||
| Return on average common equity | 8.19 | % | 0.41 | % | 1.68 | % | (0.37 | %) | 1.41 | % | 2.54 | % | 1.53 | % | |||||||||||||||||||||||||||
Return on average tangible common equity (1) | 15.00 | % | 0.76 | % | 2.81 | % | (0.53 | %) | 2.01 | % | 4.27 | % | 2.20 | % | |||||||||||||||||||||||||||
| Yield on loans | 8.14 | % | 8.17 | % | 8.41 | % | 8.37 | % | 8.48 | % | 8.27 | % | 8.87 | % | |||||||||||||||||||||||||||
| Cost of interest bearing deposits | 2.28 | % | 2.36 | % | 2.22 | % | 2.14 | % | 2.17 | % | 2.25 | % | 2.18 | % | |||||||||||||||||||||||||||
| Cost of total deposits | 1.29 | % | 1.35 | % | 1.25 | % | 1.23 | % | 1.22 | % | 1.28 | % | 1.25 | % | |||||||||||||||||||||||||||
| Cost of total funds | 1.48 | % | 1.55 | % | 1.53 | % | 1.45 | % | 1.41 | % | 1.50 | % | 1.51 | % | |||||||||||||||||||||||||||
| Net interest margin | 6.36 | % | 6.29 | % | 6.43 | % | 6.49 | % | 6.65 | % | 6.39 | % | 6.95 | % | |||||||||||||||||||||||||||
Net noninterest expense to average assets(1) | 4.16 | % | 5.08 | % | 5.13 | % | 5.61 | % | 5.17 | % | 4.98 | % | 5.43 | % | |||||||||||||||||||||||||||
Asset Quality:(2) | |||||||||||||||||||||||||||||||||||||||||
| Past due to total loans | 2.72 | % | 1.91 | % | 2.21 | % | 3.24 | % | 3.27 | % | 2.72 | % | 3.27 | % | |||||||||||||||||||||||||||
| Non-performing loans to total loans | 1.15 | % | 1.36 | % | 1.20 | % | 2.07 | % | 2.49 | % | 1.15 | % | 2.49 | % | |||||||||||||||||||||||||||
| Non-performing assets to total assets | 1.10 | % | 1.10 | % | 1.04 | % | 1.64 | % | 2.02 | % | 1.10 | % | 2.02 | % | |||||||||||||||||||||||||||
| ACL to non-performing loans | 63.44 | % | 49.53 | % | 65.02 | % | 37.47 | % | 35.93 | % | 63.44 | % | 35.93 | % | |||||||||||||||||||||||||||
| ACL to total loans | 0.73 | % | 0.67 | % | 0.78 | % | 0.78 | % | 0.90 | % | 0.73 | % | 0.90 | % | |||||||||||||||||||||||||||
| Net charge-offs to average loans | (0.10 | %) | 0.19 | % | 0.17 | % | 0.13 | % | 0.11 | % | 0.38 | % | 0.31 | % | |||||||||||||||||||||||||||
| Capital: | |||||||||||||||||||||||||||||||||||||||||
Tier 1 capital to average assets(3) | 9.86 | % | 9.55 | % | 9.46 | % | 12.04 | % | 12.03 | % | 9.86 | % | 12.03 | % | |||||||||||||||||||||||||||
Tier 1 capital to risk-weighted assets(3) | 10.74 | % | 10.20 | % | 9.98 | % | 12.90 | % | 13.06 | % | 10.74 | % | 13.06 | % | |||||||||||||||||||||||||||
Common equity tier 1 capital to risk-weighted assets(3) | 9.16 | % | 8.65 | % | 8.43 | % | 11.27 | % | 11.40 | % | 9.16 | % | 11.40 | % | |||||||||||||||||||||||||||
| Total capital to risk-weighted assets | 12.71 | % | 12.09 | % | 11.95 | % | 14.93 | % | 15.23 | % | 12.71 | % | 15.23 | % | |||||||||||||||||||||||||||
| Total equity to total assets | 14.76 | % | 14.46 | % | 14.05 | % | 14.26 | % | 14.98 | % | 14.76 | % | 14.98 | % | |||||||||||||||||||||||||||
Tangible common stockholders' equity to tangible assets(1) | 8.26 | % | 7.87 | % | 7.53 | % | 9.86 | % | 10.33 | % | 8.26 | % | 10.33 | % | |||||||||||||||||||||||||||
| Per Share Amounts: | |||||||||||||||||||||||||||||||||||||||||
| Book value per share | $ | 37.73 | $ | 36.79 | $ | 36.56 | $ | 36.25 | $ | 36.16 | $ | 37.73 | $ | 36.16 | |||||||||||||||||||||||||||
Tangible book value per share (1) | $ | 20.77 | $ | 19.70 | $ | 19.31 | $ | 25.32 | $ | 25.13 | $ | 20.77 | $ | 25.13 | |||||||||||||||||||||||||||
| Basic earnings per common share | $ | 0.77 | $ | 0.04 | $ | 0.15 | $ | (0.03) | $ | 0.13 | $ | 0.94 | $ | 0.55 | |||||||||||||||||||||||||||
| Diluted earnings per common share | $ | 0.77 | $ | 0.04 | $ | 0.15 | $ | (0.03) | $ | 0.13 | $ | 0.93 | $ | 0.54 | |||||||||||||||||||||||||||
| Shares outstanding end of period | 23,765,385 | 23,763,401 | 23,727,046 | 23,419,740 | 23,391,411 | 23,765,385 | 23,391,411 | ||||||||||||||||||||||||||||||||||
14
Unaudited consolidated balance sheet as of:
| (Dollars in thousands) | December 31, 2025 | September 30, 2025 | June 30, 2025 | March 31, 2025 | December 31, 2024 | ||||||||||||||||||||||||
| ASSETS | |||||||||||||||||||||||||||||
| Total cash and cash equivalents | $ | 248,471 | $ | 147,222 | $ | 282,346 | $ | 502,944 | $ | 330,117 | |||||||||||||||||||
| Securities - available for sale | 364,277 | 378,088 | 392,275 | 411,925 | 381,561 | ||||||||||||||||||||||||
| Securities - held to maturity, net | 1,550 | 1,766 | 1,782 | 1,731 | 1,876 | ||||||||||||||||||||||||
| Equity securities with readily determinable fair value | 4,588 | 4,569 | 4,526 | 4,512 | 4,445 | ||||||||||||||||||||||||
| Loans held for sale | 459 | 9,741 | 6,066 | 2,950 | 1,172 | ||||||||||||||||||||||||
| Loans held for investment | 4,991,307 | 4,986,922 | 4,953,170 | 4,666,223 | 4,546,960 | ||||||||||||||||||||||||
| Allowance for credit losses | (36,511) | (33,549) | (38,691) | (36,229) | (40,714) | ||||||||||||||||||||||||
| Loans, net | 4,954,796 | 4,953,373 | 4,914,479 | 4,629,994 | 4,506,246 | ||||||||||||||||||||||||
| FHLB and other restricted stock | 14,253 | 14,092 | 13,339 | 12,987 | 14,054 | ||||||||||||||||||||||||
| Premises and equipment, net | 91,071 | 141,141 | 149,120 | 150,247 | 160,737 | ||||||||||||||||||||||||
| Capitalized software, net | 46,370 | 44,934 | 43,011 | 40,869 | 37,971 | ||||||||||||||||||||||||
| Goodwill | 355,296 | 353,898 | 353,900 | 241,949 | 241,949 | ||||||||||||||||||||||||
| Intangible assets, net | 47,888 | 52,291 | 55,265 | 13,963 | 16,259 | ||||||||||||||||||||||||
| Bank-owned life insurance | 64,887 | 64,338 | 63,787 | 63,200 | 62,690 | ||||||||||||||||||||||||
| Deferred tax asset, net | 181 | — | 3,023 | 11,868 | 13,581 | ||||||||||||||||||||||||
| Other assets | 186,501 | 191,696 | 211,829 | 179,255 | 176,317 | ||||||||||||||||||||||||
| Total assets | $ | 6,380,588 | $ | 6,357,149 | $ | 6,494,748 | $ | 6,268,394 | $ | 5,948,975 | |||||||||||||||||||
| LIABILITIES | |||||||||||||||||||||||||||||
| Noninterest bearing deposits | $ | 1,901,638 | $ | 2,095,017 | $ | 2,285,327 | $ | 2,260,048 | $ | 1,964,457 | |||||||||||||||||||
| Interest bearing deposits | 3,048,578 | 2,860,229 | 2,900,771 | 2,716,702 | 2,856,363 | ||||||||||||||||||||||||
| Total deposits | 4,950,216 | 4,955,246 | 5,186,098 | 4,976,750 | 4,820,820 | ||||||||||||||||||||||||
| Federal Home Loan Bank advances | 280,000 | 280,000 | 180,000 | 205,000 | 30,000 | ||||||||||||||||||||||||
| Subordinated notes | 69,879 | 69,829 | 69,780 | 69,732 | 69,662 | ||||||||||||||||||||||||
| Junior subordinated debentures | 42,991 | 42,829 | 42,666 | 42,507 | 42,352 | ||||||||||||||||||||||||
| Deferred tax liabilities, net | — | 687 | — | — | — | ||||||||||||||||||||||||
| Other liabilities | 95,731 | 89,225 | 103,822 | 80,478 | 95,222 | ||||||||||||||||||||||||
| Total liabilities | 5,438,817 | 5,437,816 | 5,582,366 | 5,374,467 | 5,058,056 | ||||||||||||||||||||||||
| EQUITY | |||||||||||||||||||||||||||||
| Preferred Stock | 45,000 | 45,000 | 45,000 | 45,000 | 45,000 | ||||||||||||||||||||||||
| Common stock | 295 | 295 | 295 | 292 | 291 | ||||||||||||||||||||||||
| Additional paid-in-capital | 597,466 | 593,624 | 588,302 | 572,143 | 567,884 | ||||||||||||||||||||||||
| Treasury stock, at cost | (270,619) | (270,619) | (270,619) | (268,520) | (268,356) | ||||||||||||||||||||||||
| Retained earnings | 571,368 | 552,956 | 552,049 | 548,431 | 549,215 | ||||||||||||||||||||||||
| Accumulated other comprehensive income (loss) | (1,739) | (1,923) | (2,645) | (3,419) | (3,115) | ||||||||||||||||||||||||
| Total stockholders' equity | 941,771 | 919,333 | 912,382 | 893,927 | 890,919 | ||||||||||||||||||||||||
| Total liabilities and equity | $ | 6,380,588 | $ | 6,357,149 | $ | 6,494,748 | $ | 6,268,394 | $ | 5,948,975 | |||||||||||||||||||
15
Unaudited consolidated statement of income:
| For the Three Months Ended | For the Year Ended | ||||||||||||||||||||||||||||||||||||||||
| (Dollars in thousands) | December 31, 2025 | September 30, 2025 | June 30, 2025 | March 31, 2025 | December 31, 2024 | December 31, 2025 | December 31, 2024 | ||||||||||||||||||||||||||||||||||
| Interest income: | |||||||||||||||||||||||||||||||||||||||||
| Loans, including fees | $ | 55,233 | $ | 56,400 | $ | 54,836 | $ | 53,576 | $ | 52,493 | $ | 220,045 | $ | 213,831 | |||||||||||||||||||||||||||
| Factored receivables, including fees | 46,165 | 43,841 | 44,217 | 38,694 | 41,351 | 172,917 | 159,886 | ||||||||||||||||||||||||||||||||||
| Securities | 5,083 | 5,489 | 5,721 | 5,308 | 6,182 | 21,601 | 23,556 | ||||||||||||||||||||||||||||||||||
| FHLB and other stock | 969 | 223 | 246 | 249 | 153 | 1,687 | 998 | ||||||||||||||||||||||||||||||||||
| Cash deposits | 2,606 | 2,987 | 4,181 | 4,443 | 5,299 | 14,217 | 24,244 | ||||||||||||||||||||||||||||||||||
| Total interest income | 110,056 | 108,940 | 109,201 | 102,270 | 105,478 | 430,467 | 422,515 | ||||||||||||||||||||||||||||||||||
| Interest expense: | |||||||||||||||||||||||||||||||||||||||||
| Deposits | 16,639 | 17,532 | 15,505 | 14,397 | 14,522 | 64,073 | 56,235 | ||||||||||||||||||||||||||||||||||
| Subordinated notes | 662 | 661 | 661 | 682 | 1,024 | 2,666 | 4,700 | ||||||||||||||||||||||||||||||||||
| Junior subordinated debentures | 1,007 | 1,049 | 1,035 | 994 | 1,129 | 4,085 | 4,647 | ||||||||||||||||||||||||||||||||||
| Other borrowings | 2,054 | 1,865 | 3,322 | 1,814 | 996 | 9,055 | 6,477 | ||||||||||||||||||||||||||||||||||
| Total interest expense | 20,362 | 21,107 | 20,523 | 17,887 | 17,671 | 79,879 | 72,059 | ||||||||||||||||||||||||||||||||||
| Net interest income | 89,694 | 87,833 | 88,678 | 84,383 | 87,807 | 350,588 | 350,456 | ||||||||||||||||||||||||||||||||||
| Credit loss expense (benefit) | (1,764) | 4,284 | (702) | 1,330 | 4,453 | 3,148 | 18,767 | ||||||||||||||||||||||||||||||||||
| Net interest income after credit loss expense (benefit) | 91,458 | 83,549 | 89,380 | 83,053 | 83,354 | 347,440 | 331,689 | ||||||||||||||||||||||||||||||||||
| Noninterest income: | |||||||||||||||||||||||||||||||||||||||||
| Service charges on deposits | 1,483 | 1,847 | 1,742 | 1,596 | 1,682 | 6,668 | 7,084 | ||||||||||||||||||||||||||||||||||
| Card income | 1,935 | 1,968 | 1,922 | 1,797 | 1,948 | 7,622 | 8,036 | ||||||||||||||||||||||||||||||||||
| Net gains (losses) on sale of securities | — | — | — | — | (1) | — | (1) | ||||||||||||||||||||||||||||||||||
| Net gains (losses) on sale of loans | 71 | 119 | 190 | 134 | (6) | 514 | 178 | ||||||||||||||||||||||||||||||||||
| Fee income | 12,247 | 14,305 | 12,755 | 9,114 | 9,048 | 48,421 | 35,377 | ||||||||||||||||||||||||||||||||||
| Insurance commissions | 735 | 1,481 | 1,282 | 1,250 | 1,338 | 4,748 | 5,883 | ||||||||||||||||||||||||||||||||||
| Other | 13,919 | 1,728 | 1,493 | 3,299 | 1,742 | 20,439 | 8,857 | ||||||||||||||||||||||||||||||||||
| Total noninterest income | 30,390 | 21,448 | 19,384 | 17,190 | 15,751 | 88,412 | 65,414 | ||||||||||||||||||||||||||||||||||
| Noninterest expense: | |||||||||||||||||||||||||||||||||||||||||
| Salaries and employee benefits | 55,086 | 60,192 | 59,882 | 58,718 | 53,943 | 233,878 | 219,580 | ||||||||||||||||||||||||||||||||||
| Occupancy, furniture and equipment | 7,431 | 7,862 | 8,139 | 8,442 | 8,112 | 31,874 | 33,014 | ||||||||||||||||||||||||||||||||||
| FDIC insurance and other regulatory assessments | 1,337 | 1,468 | 894 | 727 | 744 | 4,426 | 2,717 | ||||||||||||||||||||||||||||||||||
| Professional fees | 4,286 | 5,228 | (320) | 6,064 | 5,006 | 15,258 | 17,839 | ||||||||||||||||||||||||||||||||||
| Amortization of intangible assets | 2,826 | 2,956 | 3,400 | 2,400 | 2,799 | 11,582 | 11,992 | ||||||||||||||||||||||||||||||||||
| Advertising and promotion | 1,689 | 2,209 | 1,838 | 1,464 | 1,545 | 7,200 | 6,183 | ||||||||||||||||||||||||||||||||||
| Communications and technology | 12,911 | 12,295 | 12,315 | 12,244 | 12,299 | 49,765 | 50,922 | ||||||||||||||||||||||||||||||||||
| Software amortization | 3,081 | 2,868 | 2,865 | 1,992 | 1,831 | 10,806 | 5,846 | ||||||||||||||||||||||||||||||||||
| Travel and entertainment | 1,147 | 1,043 | 1,619 | 1,492 | 975 | 5,301 | 5,428 | ||||||||||||||||||||||||||||||||||
| Other | 8,340 | 7,593 | 10,208 | 6,630 | 6,021 | 32,771 | 23,114 | ||||||||||||||||||||||||||||||||||
| Total noninterest expense | 98,134 | 103,714 | 100,840 | 100,173 | 93,275 | 402,861 | 376,635 | ||||||||||||||||||||||||||||||||||
| Net income before income tax | 23,714 | 1,283 | 7,924 | 70 | 5,830 | 32,991 | 20,468 | ||||||||||||||||||||||||||||||||||
| Income tax expense | 4,500 | (425) | 3,504 | 53 | 1,992 | 7,632 | 4,378 | ||||||||||||||||||||||||||||||||||
| Net income | $ | 19,214 | $ | 1,708 | $ | 4,420 | $ | 17 | $ | 3,838 | $ | 25,359 | $ | 16,090 | |||||||||||||||||||||||||||
| Dividends on preferred stock | (802) | (801) | (802) | (801) | (802) | (3,206) | (3,206) | ||||||||||||||||||||||||||||||||||
| Net income available to common stockholders | $ | 18,412 | $ | 907 | $ | 3,618 | $ | (784) | $ | 3,036 | $ | 22,153 | $ | 12,884 | |||||||||||||||||||||||||||
16
Earnings per share:
| For the Three Months Ended | For the Year Ended | ||||||||||||||||||||||||||||||||||||||||
| (Dollars in thousands) | December 31, 2025 | September 30, 2025 | June 30, 2025 | March 31, 2025 | December 31, 2024 | December 31, 2025 | December 31, 2024 | ||||||||||||||||||||||||||||||||||
| Basic | |||||||||||||||||||||||||||||||||||||||||
| Net income (loss) to common stockholders | $ | 18,412 | $ | 907 | $ | 3,618 | $ | (784) | $ | 3,036 | $ | 22,153 | $ | 12,884 | |||||||||||||||||||||||||||
| Weighted average common shares outstanding | 23,764,954 | 23,752,331 | 23,590,119 | 23,362,400 | 23,339,651 | 23,618,924 | 23,286,675 | ||||||||||||||||||||||||||||||||||
| Basic earnings (loss) per common share | $ | 0.77 | $ | 0.04 | $ | 0.15 | $ | (0.03) | $ | 0.13 | $ | 0.94 | $ | 0.55 | |||||||||||||||||||||||||||
| Diluted | |||||||||||||||||||||||||||||||||||||||||
| Net income (loss) to common stockholders - diluted | $ | 18,412 | $ | 907 | $ | 3,618 | $ | (784) | $ | 3,036 | $ | 22,153 | $ | 12,884 | |||||||||||||||||||||||||||
| Weighted average common shares outstanding | 23,764,954 | 23,752,331 | 23,590,119 | 23,362,400 | 23,339,651 | 23,618,924 | 23,286,675 | ||||||||||||||||||||||||||||||||||
| Dilutive effects of: | |||||||||||||||||||||||||||||||||||||||||
| Assumed exercises of stock options | 53,795 | 59,389 | 54,952 | — | 106,713 | 62,264 | 94,036 | ||||||||||||||||||||||||||||||||||
| Restricted stock awards | — | — | 16,097 | — | 43,875 | 15,266 | 62,074 | ||||||||||||||||||||||||||||||||||
| Restricted stock units | 102,264 | 90,675 | 89,156 | — | 153,326 | 111,736 | 135,982 | ||||||||||||||||||||||||||||||||||
| Performance stock units - market based | 38,245 | 18,812 | 17,704 | — | 223,173 | 35,535 | 198,617 | ||||||||||||||||||||||||||||||||||
| Employee stock purchase plan | 2,645 | 3,651 | 4,627 | — | 2,711 | 3,723 | 2,008 | ||||||||||||||||||||||||||||||||||
| Weighted average shares outstanding - diluted | 23,961,903 | 23,924,858 | 23,772,655 | 23,362,400 | 23,869,449 | 23,847,448 | 23,779,392 | ||||||||||||||||||||||||||||||||||
| Diluted earnings (loss) per common share | $ | 0.77 | $ | 0.04 | $ | 0.15 | $ | (0.03) | $ | 0.13 | $ | 0.93 | $ | 0.54 | |||||||||||||||||||||||||||
Shares that were not considered in computing diluted earnings per common share because they were antidilutive or have not met the thresholds to be considered in the dilutive calculation are as follows:
| For the Three Months Ended | For the Year Ended | ||||||||||||||||||||||||||||||||||||||||
| December 31, 2025 | September 30, 2025 | June 30, 2025 | March 31, 2025 | December 31, 2024 | December 31, 2025 | December 31, 2024 | |||||||||||||||||||||||||||||||||||
| Stock options | 177,436 | 181,647 | 199,859 | 253,629 | 43,582 | 150,466 | 48,650 | ||||||||||||||||||||||||||||||||||
| Restricted stock awards | — | — | — | 48,076 | — | — | — | ||||||||||||||||||||||||||||||||||
| Restricted stock units | — | — | 5,171 | 203,812 | — | 3,750 | 7,500 | ||||||||||||||||||||||||||||||||||
| Performance stock units - market based | 60,840 | 77,074 | 56,311 | 82,020 | 23,476 | 48,587 | 15,715 | ||||||||||||||||||||||||||||||||||
| Employee stock purchase plan | — | — | — | — | — | — | — | ||||||||||||||||||||||||||||||||||
Loans held for investment summarized as of:
| (Dollars in thousands) | December 31, 2025 | September 30, 2025 | June 30, 2025 | March 31, 2025 | December 31, 2024 | ||||||||||||||||||||||||
| Commercial real estate | $ | 730,435 | $ | 769,314 | $ | 754,509 | $ | 811,244 | $ | 777,689 | |||||||||||||||||||
| Construction, land development, land | 224,214 | 204,247 | 221,419 | 204,021 | 203,804 | ||||||||||||||||||||||||
| 1-4 family residential properties | 193,508 | 180,970 | 172,312 | 159,105 | 154,020 | ||||||||||||||||||||||||
| Farmland | 43,433 | 43,208 | 44,069 | 47,311 | 56,366 | ||||||||||||||||||||||||
| Commercial | 1,163,664 | 1,144,872 | 1,132,269 | 1,121,740 | 1,119,245 | ||||||||||||||||||||||||
| Factored receivables | 1,462,900 | 1,424,631 | 1,401,377 | 1,350,656 | 1,204,510 | ||||||||||||||||||||||||
| Consumer | 16,819 | 17,235 | 17,520 | 7,088 | 8,000 | ||||||||||||||||||||||||
| Mortgage warehouse | 1,156,334 | 1,202,445 | 1,209,695 | 965,058 | 1,023,326 | ||||||||||||||||||||||||
| Total loans | $ | 4,991,307 | $ | 4,986,922 | $ | 4,953,170 | $ | 4,666,223 | $ | 4,546,960 | |||||||||||||||||||
17
Our banking loan portfolio consists of traditional community bank loans as well as commercial finance product lines focused on businesses that require specialized financial solutions and national lending product lines that further diversify our lending operations.
Banking loans held for investment are further summarized below:
| (Dollars in thousands) | December 31, 2025 | September 30, 2025 | June 30, 2025 | March 31, 2025 | December 31, 2024 | ||||||||||||||||||||||||
| Commercial real estate | $ | 730,435 | $ | 769,314 | $ | 754,509 | $ | 811,244 | $ | 777,689 | |||||||||||||||||||
| Construction, land development, land | 224,214 | 204,247 | 221,419 | 204,021 | 203,804 | ||||||||||||||||||||||||
| 1-4 family residential | 193,508 | 180,970 | 172,312 | 159,105 | 154,020 | ||||||||||||||||||||||||
| Farmland | 43,433 | 43,208 | 44,069 | 47,311 | 56,366 | ||||||||||||||||||||||||
| Commercial - General | 313,696 | 285,571 | 298,653 | 274,697 | 285,469 | ||||||||||||||||||||||||
| Commercial - Agriculture | 42,588 | 49,742 | 48,107 | 49,529 | 49,365 | ||||||||||||||||||||||||
| Commercial - Equipment | 587,926 | 564,984 | 543,062 | 529,359 | 511,855 | ||||||||||||||||||||||||
| Commercial - Asset-based lending | 180,012 | 198,809 | 192,793 | 214,000 | 205,353 | ||||||||||||||||||||||||
| Commercial - Liquid Credit | 36,482 | 42,593 | 47,061 | 53,075 | 65,053 | ||||||||||||||||||||||||
| Consumer | 16,819 | 17,235 | 17,520 | 7,088 | 8,000 | ||||||||||||||||||||||||
| Mortgage Warehouse | 1,156,334 | 1,202,445 | 1,209,695 | 965,058 | 1,023,326 | ||||||||||||||||||||||||
| Total banking loans held for investment | $ | 3,525,447 | $ | 3,559,118 | $ | 3,549,200 | $ | 3,314,487 | $ | 3,340,300 | |||||||||||||||||||
The following table presents the Company’s operating segments:
| (Dollars in thousands) | Total | Corporate | ||||||||||||||||||||||||||||||||||||||||||
| Three Months Ended December 31, 2025 | Banking | Factoring | Payments | Intelligence | Segments | and Other(1) | Consolidated | |||||||||||||||||||||||||||||||||||||
| Total interest income | $ | 63,703 | $ | 39,336 | $ | 6,936 | $ | — | $ | 109,975 | $ | 81 | $ | 110,056 | ||||||||||||||||||||||||||||||
| Intersegment interest allocations | 5,903 | (8,682) | 2,779 | — | — | — | — | |||||||||||||||||||||||||||||||||||||
| Total interest expense | 18,686 | 7 | — | — | 18,693 | 1,669 | 20,362 | |||||||||||||||||||||||||||||||||||||
| Net interest income (expense) | 50,920 | 30,647 | 9,715 | — | 91,282 | (1,588) | 89,694 | |||||||||||||||||||||||||||||||||||||
| Credit loss expense (benefit) | (3,421) | 1,400 | 28 | — | (1,993) | 229 | (1,764) | |||||||||||||||||||||||||||||||||||||
| Net interest income after credit loss expense | 54,341 | 29,247 | 9,687 | — | 93,275 | (1,817) | 91,458 | |||||||||||||||||||||||||||||||||||||
| Noninterest income | 2,931 | 1,687 | 8,623 | 2,347 | 15,588 | 14,802 | 30,390 | |||||||||||||||||||||||||||||||||||||
| Noninterest expense: | ||||||||||||||||||||||||||||||||||||||||||||
| Salaries and employee benefits | 14,355 | 12,232 | 8,544 | 2,571 | 37,702 | 17,384 | 55,086 | |||||||||||||||||||||||||||||||||||||
| Depreciation | 1,583 | 348 | 182 | 14 | 2,127 | 1,146 | 3,273 | |||||||||||||||||||||||||||||||||||||
| Other occupancy, furniture and equipment | 1,997 | 468 | 141 | 16 | 2,622 | 1,536 | 4,158 | |||||||||||||||||||||||||||||||||||||
| FDIC insurance and other regulatory assessments | 1,337 | — | — | — | 1,337 | — | 1,337 | |||||||||||||||||||||||||||||||||||||
| Professional fees | 2,005 | 137 | 271 | (15) | 2,398 | 1,888 | 4,286 | |||||||||||||||||||||||||||||||||||||
| Amortization of intangible assets | 385 | 193 | 878 | 1,291 | 2,747 | 79 | 2,826 | |||||||||||||||||||||||||||||||||||||
| Advertising and promotion | 408 | 194 | 818 | 27 | 1,447 | 242 | 1,689 | |||||||||||||||||||||||||||||||||||||
| Communications and technology | 5,186 | 2,290 | 2,755 | 326 | 10,557 | 2,354 | 12,911 | |||||||||||||||||||||||||||||||||||||
| Software amortization | — | 1,014 | 1,684 | 30 | 2,728 | 353 | 3,081 | |||||||||||||||||||||||||||||||||||||
| Travel and entertainment | 133 | 119 | 227 | 202 | 681 | 466 | 1,147 | |||||||||||||||||||||||||||||||||||||
| Other | 4,450 | 765 | 1,758 | 210 | 7,183 | 1,157 | 8,340 | |||||||||||||||||||||||||||||||||||||
| Total noninterest expense | 31,839 | 17,760 | 17,258 | 4,672 | 71,529 | 26,605 | 98,134 | |||||||||||||||||||||||||||||||||||||
Net intersegment noninterest income (expense)(2) | 138 | 502 | (640) | — | — | — | — | |||||||||||||||||||||||||||||||||||||
| Operating income (loss) | $ | 25,571 | $ | 13,676 | $ | 412 | $ | (2,325) | $ | 37,334 | $ | (13,620) | $ | 23,714 | ||||||||||||||||||||||||||||||
18
| (Dollars in thousands) | Total | Corporate | ||||||||||||||||||||||||||||||||||||||||||
| Three Months Ended September 30, 2025 | Banking | Factoring | Payments | Intelligence | Segments | and Other(1) | Consolidated | |||||||||||||||||||||||||||||||||||||
| Total interest income | $ | 64,931 | $ | 37,157 | $ | 6,769 | $ | — | $ | 108,857 | $ | 83 | $ | 108,940 | ||||||||||||||||||||||||||||||
| Intersegment interest allocations | 6,657 | (9,600) | 2,943 | — | — | — | — | |||||||||||||||||||||||||||||||||||||
| Total interest expense | 19,391 | 6 | — | — | 19,397 | 1,710 | 21,107 | |||||||||||||||||||||||||||||||||||||
| Net interest income (expense) | 52,197 | 27,551 | 9,712 | — | 89,460 | (1,627) | 87,833 | |||||||||||||||||||||||||||||||||||||
| Credit loss expense (benefit) | 1,973 | 2,302 | 9 | — | 4,284 | — | 4,284 | |||||||||||||||||||||||||||||||||||||
| Net interest income after credit loss expense | 50,224 | 25,249 | 9,703 | — | 85,176 | (1,627) | 83,549 | |||||||||||||||||||||||||||||||||||||
| Noninterest income | 8,364 | 1,585 | 8,462 | 2,338 | 20,749 | 699 | 21,448 | |||||||||||||||||||||||||||||||||||||
| Noninterest expense: | ||||||||||||||||||||||||||||||||||||||||||||
| Salaries and employee benefits | 15,349 | 13,674 | 8,769 | 3,767 | 41,559 | 18,633 | 60,192 | |||||||||||||||||||||||||||||||||||||
| Depreciation | 1,603 | 449 | 203 | 15 | 2,270 | 1,431 | 3,701 | |||||||||||||||||||||||||||||||||||||
| Other occupancy, furniture and equipment | 2,134 | 525 | 152 | 17 | 2,828 | 1,333 | 4,161 | |||||||||||||||||||||||||||||||||||||
| FDIC insurance and other regulatory assessments | 1,468 | — | — | — | 1,468 | — | 1,468 | |||||||||||||||||||||||||||||||||||||
| Professional fees | 1,194 | 45 | 248 | 131 | 1,618 | 3,610 | 5,228 | |||||||||||||||||||||||||||||||||||||
| Amortization of intangible assets | 385 | 193 | 904 | 1,360 | 2,842 | 114 | 2,956 | |||||||||||||||||||||||||||||||||||||
| Advertising and promotion | 416 | 186 | 1,221 | 56 | 1,879 | 330 | 2,209 | |||||||||||||||||||||||||||||||||||||
| Communications and technology | 4,541 | 2,251 | 2,713 | 381 | 9,886 | 2,409 | 12,295 | |||||||||||||||||||||||||||||||||||||
| Software amortization | — | 952 | 1,550 | 12 | 2,514 | 354 | 2,868 | |||||||||||||||||||||||||||||||||||||
| Travel and entertainment | 188 | 108 | 179 | 127 | 602 | 441 | 1,043 | |||||||||||||||||||||||||||||||||||||
| Other | 4,393 | 702 | 1,155 | 70 | 6,320 | 1,273 | 7,593 | |||||||||||||||||||||||||||||||||||||
| Total noninterest expense | 31,671 | 19,085 | 17,094 | 5,936 | 73,786 | 29,928 | 103,714 | |||||||||||||||||||||||||||||||||||||
Intersegment noninterest income (expense)(2) | 158 | 463 | (621) | — | — | — | — | |||||||||||||||||||||||||||||||||||||
| Operating income (loss) | $ | 27,075 | $ | 8,212 | $ | 450 | $ | (3,598) | $ | 32,139 | $ | (30,856) | $ | 1,283 | ||||||||||||||||||||||||||||||
(1) Includes revenue and expense from the Company’s holding company, which does not meet the definition of an operating segment. Also includes corporate shared service costs such as the majority of salaries and benefits expense for our executive leadership team, as well as other selling, general, and administrative shared services costs including human resources, accounting, finance, risk management and a significant amount of information technology expense. For the three months ended December 31, 2025, noninterest income in the Corporate and Other category included a gain of $8.7 million on the sale of the building purchased in 2024 and a gain of $5.6 million on the sale of an aircraft.
(2) Intersegment noninterest income (expense) includes:
| (Dollars in thousands) | Banking | Factoring | Payments | |||||||||||||||||
| Three Months Ended December 31, 2025 | ||||||||||||||||||||
| Factoring revenue received from Payments | $ | — | $ | 911 | $ | (911) | ||||||||||||||
| Payments revenue received from Factoring | — | (290) | 290 | |||||||||||||||||
| Banking revenue received from Payments and Factoring | 138 | (119) | (19) | |||||||||||||||||
| Intersegment noninterest income (expense) | $ | 138 | $ | 502 | $ | (640) | ||||||||||||||
| Three Months Ended September 30, 2025 | ||||||||||||||||||||
| Factoring revenue received from Payments | $ | — | $ | 911 | $ | (911) | ||||||||||||||
| Payments revenue received from Factoring | — | (329) | 329 | |||||||||||||||||
| Banking revenue received from Payments and Factoring | 158 | (119) | (39) | |||||||||||||||||
| Intersegment noninterest income (expense) | $ | 158 | $ | 463 | $ | (621) | ||||||||||||||
19
Information pertaining to our Factoring segment, summarized as of and for the quarters ended:
| Factoring | December 31, 2025 | September 30, 2025 | June 30, 2025 | March 31, 2025 | December 31, 2024 | |||||||||||||||||||||||||||
| Factored receivable period end balance | $ | 1,220,780,000 | $ | 1,193,849,000 | $ | 1,174,830,000 | $ | 1,146,429,000 | $ | 1,032,842,000 | ||||||||||||||||||||||
| Commercial loans period end balance | $ | 2,960,000 | $ | 3,173,000 | $ | 2,593,000 | $ | 1,080,000 | $ | 2,150,000 | ||||||||||||||||||||||
Yield on average receivable balance(1) | 12.79 | % | 12.63 | % | 13.40 | % | 12.75 | % | 13.36 | % | ||||||||||||||||||||||
Current quarter charge-off rate(2) | 0.03 | % | 0.33 | % | (0.19 | %) | 0.11 | % | 0.26 | % | ||||||||||||||||||||||
| Factored receivables - transportation concentration | 97 | % | 96 | % | 96 | % | 97 | % | 97 | % | ||||||||||||||||||||||
| Interest income, including fees | $ | 39,336,000 | $ | 37,157,000 | $ | 38,040,000 | $ | 33,331,000 | $ | 35,754,000 | ||||||||||||||||||||||
| Noninterest income | 1,687,000 | 1,585,000 | 1,811,000 | 1,719,000 | 1,594,000 | |||||||||||||||||||||||||||
| Intersegment noninterest income | 911,000 | 911,000 | 910,000 | 911,000 | 864,000 | |||||||||||||||||||||||||||
| Factoring total revenue | 41,934,000 | 39,653,000 | 40,761,000 | 35,961,000 | 38,212,000 | |||||||||||||||||||||||||||
| Average net funds employed | 1,143,597,000 | 1,097,229,000 | 1,065,073,000 | 948,729,000 | 950,776,000 | |||||||||||||||||||||||||||
Yield on average net funds employed(1) | 14.55 | % | 14.34 | % | 15.35 | % | 15.37 | % | 15.99 | % | ||||||||||||||||||||||
| Operating income (loss) | $ | 13,676,000 | $ | 8,212,000 | $ | 19,754,000 | $ | 6,919,000 | $ | 9,046,000 | ||||||||||||||||||||||
| Factoring total revenue | $ | 41,934,000 | $ | 39,653,000 | $ | 40,761,000 | $ | 35,961,000 | $ | 38,212,000 | ||||||||||||||||||||||
Operating margin(1) | 32.61 | % | 20.71 | % | 48.46 | % | 19.24 | % | 23.67 | % | ||||||||||||||||||||||
| Accounts receivable purchased | $ | 3,119,443,000 | $ | 2,997,895,000 | $ | 2,873,659,000 | $ | 2,707,805,000 | $ | 2,747,351,000 | ||||||||||||||||||||||
| Number of invoices purchased | 1,744,811 | 1,735,860 | 1,697,851 | 1,497,644 | 1,524,904 | |||||||||||||||||||||||||||
| Average invoice size | $ | 1,788 | $ | 1,727 | $ | 1,693 | $ | 1,808 | $ | 1,802 | ||||||||||||||||||||||
| Average invoice size - transportation | $ | 1,751 | $ | 1,690 | $ | 1,663 | $ | 1,769 | $ | 1,767 | ||||||||||||||||||||||
| Average invoice size - non-transportation | $ | 4,470 | $ | 4,381 | $ | 3,638 | $ | 4,019 | $ | 4,867 | ||||||||||||||||||||||
(1)Operating margin is a non-GAAP financial measure used as a supplemental measure to evaluate the performance of our Factoring segment. For the three months ended June 30, 2025, operating income and factoring total revenue were impacted by $1.2 million of interest and fees resulting from the USPS Settlement and such settlement further impacted operating income by $7.4 million of legal expense accrual reversal and $3.8 million of recovery of factoring balances charged-off in a prior period. Operating income was also impacted by a $2.0 million legal settlement that was unrelated to the USPS Settlement. Such items had a 24.71% impact on operating margin, a 0.43% impact on yield on average receivables, and a 0.46% impact on yield on average net funds employed for the three months ended June 30, 2025.
(2)The current quarter charge-off rate for the three months ended June 30, 2025 reflects a $3.8 million recovery of factoring balances charged off in a prior period. Such recovery impacted the current quarter charge-off rate for that period by (0.33%).
20
Information pertaining to our Payments segment, summarized as of and for the quarters ended:
| Payments | December 31, 2025 | September 30, 2025 | June 30, 2025 | March 31, 2025 | December 31, 2024 | |||||||||||||||||||||||||||
| Supply chain financing factored receivables | $ | 174,292,000 | $ | 157,662,000 | $ | 152,054,000 | $ | 122,583,000 | $ | 107,300,000 | ||||||||||||||||||||||
| Quickpay and other factored receivables | 67,828,000 | 73,120,000 | 74,493,000 | 81,644,000 | 64,368,000 | |||||||||||||||||||||||||||
| Total factored receivable period end balance | $ | 242,120,000 | $ | 230,782,000 | $ | 226,547,000 | $ | 204,227,000 | $ | 171,668,000 | ||||||||||||||||||||||
| Total revenue | ||||||||||||||||||||||||||||||||
| Supply chain finance interest income | $ | 4,177,000 | $ | 3,895,000 | $ | 3,412,000 | $ | 2,695,000 | $ | 2,789,000 | ||||||||||||||||||||||
| Quickpay interest income | 2,759,000 | 2,874,000 | 2,818,000 | 2,668,000 | 2,808,000 | |||||||||||||||||||||||||||
| Intersegment interest income allocation | 2,779,000 | 2,943,000 | 2,896,000 | 2,918,000 | 2,730,000 | |||||||||||||||||||||||||||
| Total interest income | 9,715,000 | 9,712,000 | 9,126,000 | 8,281,000 | 8,327,000 | |||||||||||||||||||||||||||
| Broker noninterest income | 7,330,000 | 7,131,000 | 6,443,000 | 5,178,000 | 5,082,000 | |||||||||||||||||||||||||||
| Factor noninterest income | 952,000 | 933,000 | 993,000 | 1,233,000 | 1,346,000 | |||||||||||||||||||||||||||
| Other noninterest income | 341,000 | 398,000 | 288,000 | 120,000 | (80,000) | |||||||||||||||||||||||||||
| Intersegment noninterest income | 290,000 | 329,000 | 381,000 | 372,000 | 356,000 | |||||||||||||||||||||||||||
| Total noninterest income | 8,913,000 | 8,791,000 | 8,105,000 | 6,903,000 | 6,704,000 | |||||||||||||||||||||||||||
| $ | 18,628,000 | $ | 18,503,000 | $ | 17,231,000 | $ | 15,184,000 | $ | 15,031,000 | |||||||||||||||||||||||
| Total expense | ||||||||||||||||||||||||||||||||
| Credit loss expense (benefit) | $ | 28,000 | $ | 9,000 | $ | 92,000 | $ | 118,000 | $ | 2,000 | ||||||||||||||||||||||
| Noninterest expense | 17,258,000 | 17,094,000 | 16,844,000 | 17,113,000 | 15,820,000 | |||||||||||||||||||||||||||
| Intersegment noninterest expense | 930,000 | 950,000 | 949,000 | 944,000 | 895,000 | |||||||||||||||||||||||||||
| $ | 18,216,000 | $ | 18,053,000 | $ | 17,885,000 | $ | 18,175,000 | $ | 16,717,000 | |||||||||||||||||||||||
| Pre-tax operating income (loss) | $ | 412,000 | $ | 450,000 | $ | (654,000) | $ | (2,991,000) | $ | (1,686,000) | ||||||||||||||||||||||
| Depreciation expense | 182,000 | 203,000 | 222,000 | 230,000 | 243,000 | |||||||||||||||||||||||||||
| Software amortization expense | 1,684,000 | 1,550,000 | 1,413,000 | 1,196,000 | 1,049,000 | |||||||||||||||||||||||||||
| Intangible amortization expense | 878,000 | 904,000 | 1,418,000 | 1,551,000 | 1,687,000 | |||||||||||||||||||||||||||
Earnings (losses) before interest, taxes, depreciation, and amortization(1) | $ | 3,156,000 | $ | 3,107,000 | $ | 2,399,000 | $ | (14,000) | $ | 1,293,000 | ||||||||||||||||||||||
EBITDA Margin(1) | 16.9 | % | 16.8 | % | 13.9 | % | (0.1) | % | 8.6 | % | ||||||||||||||||||||||
| Number of invoices processed | 9,053,274 | 8,826,848 | 8,500,565 | 7,182,044 | 6,788,408 | |||||||||||||||||||||||||||
| Amount of payments processed | $ | 10,995,478,000 | $ | 10,662,418,000 | $ | 10,081,206,000 | $ | 8,777,825,000 | $ | 7,625,735,000 | ||||||||||||||||||||||
| Network invoice volume | 1,090,848 | 1,057,606 | 1,004,603 | 719,531 | 567,258 | |||||||||||||||||||||||||||
| Network payment volume | $ | 1,829,509,000 | $ | 1,696,817,000 | $ | 1,579,662,000 | $ | 1,167,464,000 | $ | 922,927,000 | ||||||||||||||||||||||
(1)Earnings (losses) before interest, taxes, depreciation, and amortization ("EBITDA") and EBITDA margin are non-GAAP financial measures used as supplemental measures to evaluate the performance of our Payments segment.
21
Information pertaining to our Intelligence segment, summarized as of and for the quarters ended:
| Intelligence | December 31, 2025 | September 30, 2025 | ||||||||||||
| Revenue | $ | 2,347,000 | $ | 2,338,000 | ||||||||||
| Cost of revenue | 283,000 | 266,000 | ||||||||||||
| Gross profit | 2,064,000 | 2,072,000 | ||||||||||||
| Selling, general and administrative costs | 4,389,000 | 5,670,000 | ||||||||||||
| Pre-tax operating income (loss) | $ | (2,325,000) | $ | (3,598,000) | ||||||||||
Gross Margin(1) | 88 | % | 89 | % | ||||||||||
*prior periods not meaningful
(1)Gross margin is a non-GAAP financial measure used as supplemental measure to evaluate the performance of our Intelligence segment. Cost of revenues is comprised primarily of salaries and benefits and communications and technology costs for employees providing services to the Company's customers. This includes the costs of the Company's personnel performing integration, customer support, third-party data center and customer training activities. Cost of revenues also includes the direct costs of third party hosting services. We have elected to exclude amortization expense of capitalized developed software and acquired technology, as well as allocations of fixed asset depreciation expense and occupancy expenses from cost of revenues.
Deposits summarized as of:
| (Dollars in thousands) | December 31, 2025 | September 30, 2025 | June 30, 2025 | March 31, 2025 | December 31, 2024 | ||||||||||||||||||||||||
| Non-interest bearing demand | $ | 1,901,638 | $ | 2,095,017 | $ | 2,285,327 | $ | 2,260,048 | $ | 1,964,457 | |||||||||||||||||||
| Interest bearing demand | 845,060 | 668,576 | 694,005 | 731,477 | 697,949 | ||||||||||||||||||||||||
| Individual retirement accounts | 37,634 | 39,133 | 40,888 | 42,344 | 43,937 | ||||||||||||||||||||||||
| Money market | 608,036 | 580,748 | 565,781 | 610,120 | 629,610 | ||||||||||||||||||||||||
| Savings | 522,189 | 522,469 | 517,474 | 525,133 | 515,545 | ||||||||||||||||||||||||
| Certificates of deposit | 224,644 | 228,415 | 230,179 | 231,076 | 232,232 | ||||||||||||||||||||||||
| Brokered time deposits | 695,093 | 705,772 | 701,059 | 576,552 | 490,650 | ||||||||||||||||||||||||
| Other brokered deposits | 115,922 | 115,116 | 151,385 | — | 246,440 | ||||||||||||||||||||||||
| Total deposits | $ | 4,950,216 | $ | 4,955,246 | $ | 5,186,098 | $ | 4,976,750 | $ | 4,820,820 | |||||||||||||||||||
22
Net interest margin summarized for the three months ended:
| December 31, 2025 | September 30, 2025 | ||||||||||||||||||||||||||||||||||
| (Dollars in thousands) | Average Balance | Interest | Average Rate(4) | Average Balance | Interest | Average Rate(4) | |||||||||||||||||||||||||||||
| Interest earning assets: | |||||||||||||||||||||||||||||||||||
| Interest earning cash balances | $ | 260,766 | $ | 2,606 | 3.96 | % | $ | 268,704 | $ | 2,987 | 4.41 | % | |||||||||||||||||||||||
| Taxable securities | 374,076 | 5,068 | 5.38 | % | 388,181 | 5,473 | 5.59 | % | |||||||||||||||||||||||||||
| Tax-exempt securities | 2,394 | 15 | 2.49 | % | 2,511 | 16 | 2.53 | % | |||||||||||||||||||||||||||
| FHLB and other restricted stock | 14,107 | 969 | 27.25 | % | 13,176 | 223 | 6.71 | % | |||||||||||||||||||||||||||
Loans(1) | 4,939,502 | 101,398 | 8.14 | % | 4,864,878 | 100,241 | 8.17 | % | |||||||||||||||||||||||||||
| Total interest earning assets | $ | 5,590,845 | $ | 110,056 | 7.81 | % | $ | 5,537,450 | $ | 108,940 | 7.81 | % | |||||||||||||||||||||||
| Non-interest earning assets: | |||||||||||||||||||||||||||||||||||
| Other assets | 874,702 | 887,821 | |||||||||||||||||||||||||||||||||
| Total assets | $ | 6,465,547 | $ | 6,425,271 | |||||||||||||||||||||||||||||||
| Interest bearing liabilities: | |||||||||||||||||||||||||||||||||||
| Deposits: | |||||||||||||||||||||||||||||||||||
| Interest bearing demand | $ | 674,985 | $ | 834 | 0.49 | % | $ | 689,220 | $ | 856 | 0.49 | % | |||||||||||||||||||||||
| Individual retirement accounts | 38,434 | 120 | 1.24 | % | 40,176 | 125 | 1.23 | % | |||||||||||||||||||||||||||
| Money market | 588,528 | 3,896 | 2.63 | % | 584,459 | 3,989 | 2.71 | % | |||||||||||||||||||||||||||
| Savings | 523,816 | 1,540 | 1.17 | % | 518,854 | 1,480 | 1.13 | % | |||||||||||||||||||||||||||
| Certificates of deposit | 227,577 | 1,582 | 2.76 | % | 228,802 | 1,497 | 2.60 | % | |||||||||||||||||||||||||||
| Brokered time deposits | 720,088 | 7,515 | 4.14 | % | 744,436 | 8,017 | 4.27 | % | |||||||||||||||||||||||||||
| Other brokered deposits | 115,676 | 1,152 | 3.95 | % | 142,814 | 1,568 | 4.36 | % | |||||||||||||||||||||||||||
| Total interest bearing deposits | 2,889,104 | 16,639 | 2.28 | % | 2,948,761 | 17,532 | 2.36 | % | |||||||||||||||||||||||||||
| Federal Home Loan Bank advances | 203,641 | 2,054 | 4.00 | % | 166,141 | 1,865 | 4.45 | % | |||||||||||||||||||||||||||
| Subordinated notes | 69,853 | 662 | 3.76 | % | 69,797 | 661 | 3.76 | % | |||||||||||||||||||||||||||
| Junior subordinated debentures | 42,885 | 1,007 | 9.32 | % | 42,729 | 1,049 | 9.74 | % | |||||||||||||||||||||||||||
| Other borrowings | 1 | — | — | % | — | — | — | % | |||||||||||||||||||||||||||
| Total interest bearing liabilities | $ | 3,205,484 | $ | 20,362 | 2.52 | % | $ | 3,227,428 | $ | 21,107 | 2.59 | % | |||||||||||||||||||||||
| Noninterest bearing liabilities and equity: | |||||||||||||||||||||||||||||||||||
| Non-interest bearing demand deposits | 2,239,961 | 2,188,828 | |||||||||||||||||||||||||||||||||
| Other liabilities | 83,079 | 83,556 | |||||||||||||||||||||||||||||||||
| Total equity | 937,023 | 925,459 | |||||||||||||||||||||||||||||||||
| Total liabilities and equity | $ | 6,465,547 | $ | 6,425,271 | |||||||||||||||||||||||||||||||
| Net interest income | $ | 89,694 | $ | 87,833 | |||||||||||||||||||||||||||||||
Interest spread(2) | 5.29 | % | 5.22 | % | |||||||||||||||||||||||||||||||
Net interest margin(3) | 6.36 | % | 6.29 | % | |||||||||||||||||||||||||||||||
(1) Loan balance totals include respective nonaccrual assets.
(2) Net interest spread is the yield on average interest earning assets less the rate on interest bearing liabilities.
(3) Net interest margin is the ratio of net interest income to average interest earning assets.
(4) Average rates have been annualized.
23
Additional information pertaining to our loan portfolio, including loans held for investment and loans held for sale, summarized for the quarters ended:
| (Dollars in thousands) | December 31, 2025 | September 30, 2025 | June 30, 2025 | March 31, 2025 | December 31, 2024 | ||||||||||||||||||||||||
| Average Banking loans | $ | 3,491,230 | $ | 3,484,400 | $ | 3,381,919 | $ | 3,237,692 | $ | 3,163,999 | |||||||||||||||||||
| Average Factoring receivables | 1,219,914 | 1,167,092 | 1,138,792 | 1,060,482 | 1,064,772 | ||||||||||||||||||||||||
| Average Payments receivables | 228,358 | 213,386 | 204,529 | 173,536 | 175,218 | ||||||||||||||||||||||||
| Average total loans | $ | 4,939,502 | $ | 4,864,878 | $ | 4,725,240 | $ | 4,471,710 | $ | 4,403,989 | |||||||||||||||||||
| Banking yield | 6.26 | % | 6.41 | % | 6.50 | % | 6.71 | % | 6.60 | % | |||||||||||||||||||
| Factoring yield | 12.79 | % | 12.63 | % | 13.40 | % | 12.75 | % | 13.36 | % | |||||||||||||||||||
| Payments yield | 12.05 | % | 12.59 | % | 12.22 | % | 12.53 | % | 12.71 | % | |||||||||||||||||||
| Total loan yield | 8.14 | % | 8.17 | % | 8.41 | % | 8.37 | % | 8.48 | % | |||||||||||||||||||
Metrics and non-GAAP financial:
| As of and for the Three Months Ended | As of and for the Year Ended | |||||||||||||||||||||||||||||||||||||||||||
| (Dollars in thousands, except per share amounts) | December 31, 2025 | September 30, 2025 | June 30, 2025 | March 31, 2025 | December 31, 2024 | December 31, 2025 | December 31, 2024 | |||||||||||||||||||||||||||||||||||||
| Average total stockholders' equity | $ | 937,023 | $ | 925,459 | $ | 910,202 | $ | 902,260 | $ | 898,965 | $ | 918,850 | $ | 886,900 | ||||||||||||||||||||||||||||||
| Average preferred stock liquidation preference | (45,000) | (45,000) | (45,000) | (45,000) | (45,000) | (45,000) | (45,000) | |||||||||||||||||||||||||||||||||||||
| Average total common stockholders' equity | 892,023 | 880,459 | 865,202 | 857,260 | 853,965 | 873,850 | 841,900 | |||||||||||||||||||||||||||||||||||||
| Average goodwill and other intangibles | (404,893) | (408,025) | (347,894) | (257,399) | (253,415) | (355,104) | (254,924) | |||||||||||||||||||||||||||||||||||||
| Average tangible common stockholders' equity | $ | 487,130 | $ | 472,434 | $ | 517,308 | $ | 599,861 | $ | 600,550 | $ | 518,746 | $ | 586,976 | ||||||||||||||||||||||||||||||
| Net income available to common stockholders | $ | 18,412 | $ | 907 | $ | 3,618 | $ | (784) | $ | 3,036 | $ | 22,153 | $ | 12,884 | ||||||||||||||||||||||||||||||
| Average tangible common equity | 487,130 | 472,434 | 517,308 | 599,861 | 600,550 | 518,746 | 586,976 | |||||||||||||||||||||||||||||||||||||
| Return on average tangible common equity | 15.00 | % | 0.76 | % | 2.81 | % | (0.53 | %) | 2.01 | % | 4.27 | % | 2.20 | % | ||||||||||||||||||||||||||||||
| Net non-interest expense to average assets ratio: | ||||||||||||||||||||||||||||||||||||||||||||
| Noninterest expenses | $ | 98,134 | $ | 103,714 | $ | 100,840 | $ | 100,173 | $ | 93,275 | $ | 402,861 | $ | 376,635 | ||||||||||||||||||||||||||||||
| Noninterest income | $ | 30,390 | $ | 21,448 | $ | 19,384 | $ | 17,190 | $ | 15,751 | $ | 88,412 | $ | 65,414 | ||||||||||||||||||||||||||||||
| Net noninterest expenses | $ | 67,744 | $ | 82,266 | $ | 81,456 | $ | 82,983 | $ | 77,524 | $ | 314,449 | $ | 311,221 | ||||||||||||||||||||||||||||||
| Average total assets | $ | 6,465,547 | $ | 6,425,267 | $ | 6,366,984 | $ | 5,994,040 | $ | 5,966,161 | $ | 6,314,564 | $ | 5,733,069 | ||||||||||||||||||||||||||||||
| Net noninterest expense to average assets ratio | 4.16 | % | 5.08 | % | 5.13 | % | 5.61 | % | 5.17 | % | 4.98 | % | 5.43 | % | ||||||||||||||||||||||||||||||
| Total stockholders' equity | $ | 941,771 | $ | 919,333 | $ | 912,382 | $ | 893,927 | $ | 890,919 | $ | 941,771 | $ | 890,919 | ||||||||||||||||||||||||||||||
| Preferred stock liquidation preference | (45,000) | (45,000) | (45,000) | (45,000) | (45,000) | (45,000) | (45,000) | |||||||||||||||||||||||||||||||||||||
| Total common stockholders' equity | 896,771 | 874,333 | 867,382 | 848,927 | 845,919 | 896,771 | 845,919 | |||||||||||||||||||||||||||||||||||||
| Goodwill and other intangibles | (403,184) | (406,189) | (409,165) | (255,912) | (258,208) | (403,184) | (258,208) | |||||||||||||||||||||||||||||||||||||
| Tangible common stockholders' equity | $ | 493,587 | $ | 468,144 | $ | 458,217 | $ | 593,015 | $ | 587,711 | $ | 493,587 | $ | 587,711 | ||||||||||||||||||||||||||||||
| Common shares outstanding | 23,765,385 | 23,763,401 | 23,727,046 | 23,419,740 | 23,391,411 | 23,765,385 | 23,391,411 | |||||||||||||||||||||||||||||||||||||
| Tangible book value per share | $ | 20.77 | $ | 19.70 | $ | 19.31 | $ | 25.32 | $ | 25.13 | $ | 20.77 | $ | 25.13 | ||||||||||||||||||||||||||||||
| Total assets at end of period | $ | 6,380,588 | $ | 6,357,149 | $ | 6,494,748 | $ | 6,268,394 | $ | 5,948,975 | $ | 6,380,588 | $ | 5,948,975 | ||||||||||||||||||||||||||||||
| Goodwill and other intangibles | (403,184) | (406,189) | (409,165) | (255,912) | (258,208) | (403,184) | (258,208) | |||||||||||||||||||||||||||||||||||||
| Tangible assets at period end | $ | 5,977,404 | $ | 5,950,960 | $ | 6,085,583 | $ | 6,012,482 | $ | 5,690,767 | $ | 5,977,404 | $ | 5,690,767 | ||||||||||||||||||||||||||||||
| Tangible common stockholders' equity ratio | 8.26 | % | 7.87 | % | 7.53 | % | 9.86 | % | 10.33 | % | 8.26 | % | 10.33 | % | ||||||||||||||||||||||||||||||
1)Triumph Financial uses certain non-GAAP financial measures to provide meaningful supplemental information regarding Triumph Financial's operational performance and to enhance investors' overall understanding of such financial performance. The non-GAAP measures used by Triumph Financial include the following:
•"Tangible common stockholders' equity" is defined as common stockholders' equity less goodwill and other intangible assets.
•"Total tangible assets" is defined as total assets less goodwill and other intangible assets.
24
•"Tangible book value per share" is defined as tangible common stockholders' equity divided by total common shares outstanding. This measure is important to investors interested in changes from period-to-period in book value per share exclusive of changes in intangible assets.
•"Tangible common stockholders' equity ratio" is defined as the ratio of tangible common stockholders' equity divided by total tangible assets. We believe that this measure is important to many investors in the marketplace who are interested in relative changes from period-to period in common equity and total assets, each exclusive of changes in intangible assets.
•"Return on Average Tangible Common Equity" is defined as net income available to common stockholders divided by average tangible common stockholders' equity.
2)Asset quality ratios exclude loans held for sale, except for non-performing assets to total assets.
3)Current quarter ratios are preliminary.
Source: Triumph Financial, Inc.
###
Investor Relations:
Luke Wyse
Executive Vice President, Head of Investor Relations
lwyse@tfin.com
214-365-6936
Media Contact:
Amanda Tavackoli
Senior Vice President, Director of Corporate Communication
atavackoli@tfin.com
214-365-6930
25