10-K: Annual report [Section 13 and 15(d), not S-K Item 405]
Published on February 11, 2020
UNITED STATES
SECURITIES AND EXCHANGE COMMISSION
Washington, D.C. 20549
FORM
(Mark One)
|
|
ANNUAL REPORT PURSUANT TO SECTION 13 OR 15(d) OF THE SECURITIES EXCHANGE ACT OF 1934 |
For the fiscal year ended
OR
|
|
TRANSITION REPORT PURSUANT TO SECTION 13 OR 15(d) OF THE SECURITIES EXCHANGE ACT OF 1934 FOR THE TRANSITION PERIOD FROM TO |
Commission File Number
(Exact name of Registrant as specified in its Charter)
|
|
|
|
|
(State or other jurisdiction of |
|
(I.R.S. Employer |
|
|
|
|
|
|
|
|
|
(Address of principal executive offices) |
|
(Zip Code) |
Registrant’s telephone number, including area code: (
SECURITIES REGISTERED PURSUANT TO SECTION 12(B) OF THE ACT:
|
Title of Class: |
Trading Symbol(s) |
Name of Exchange on Which Registered: |
|
|
|
|
SECURITIES REGISTERED PURSUANT TO SECTION 12(G) OF THE ACT: None
Indicate by check mark if the Registrant is a well-known seasoned issuer, as defined in Rule 405 of the Securities Act.
Indicate by check mark if the Registrant is not required to file reports pursuant to Section 13 or 15(d) of the Act. Yes ☐
Indicate by check mark whether the Registrant: (1) has filed all reports required to be filed by Section 13 or 15(d) of the Securities Exchange Act of 1934 during the preceding 12 months (or for such shorter period that the Registrant was required to file such reports), and (2) has been subject to such filing requirements for the past 90 days.
Indicate by check mark whether the Registrant has submitted electronically every Interactive Data File required to be submitted pursuant to Rule 405 of Regulation S-T (§232.405 of this chapter) during the preceding 12 months (or for such shorter period that the Registrant was required to submit such files).
Indicate by check mark whether the Registrant is a large accelerated filer, an accelerated filer, a non-accelerated filer, a smaller reporting company, or an emerging growth company. See the definitions of “large accelerated filer”, “accelerated filer”, “smaller reporting company”, and “emerging growth company” in Rule 12b-2 of the Exchange Act.
|
Large accelerated filer |
☒ |
Accelerated filer |
☐ |
|
Non-accelerated filer |
☐ |
Smaller reporting company |
|
|
Emerging growth company |
|
|
|
If an emerging growth company, indicate by check mark if the registrant has elected not to use the extended transition period for complying with any new or revised financial accounting standards provided pursuant to Section 13(a) of the Exchange Act. ☐
Indicate by check mark whether the Registrant is a shell company (as defined in Rule 12b-2 of the Exchange Act). Yes
The aggregate market value of the shares of common stock held by non-affiliates based on the closing price of the common stock on the NASDAQ Global Market on June 30, 2019 was approximately $
The number of shares of Registrant’s Common Stock outstanding as of February 6, 2020 was
TABLE OF CONTENTS
|
|
|
|
|
Page |
|
|
|
|
|
|
|
|
|
|
|
|
|
|
|
|
|
|
|
Item 1. |
|
|
1 |
|
|
|
|
|
|
|
|
Item 1A. |
|
|
14 |
|
|
|
|
|
|
|
|
Item 1B. |
|
|
33 |
|
|
|
|
|
|
|
|
Item 2. |
|
|
33 |
|
|
|
|
|
|
|
|
Item 3. |
|
|
33 |
|
|
|
|
|
|
|
|
Item 4. |
|
|
33 |
|
|
|
|
|
|
|
|
|
|
|
|
|
|
|
|
|
|
|
|
Item 5. |
|
|
34 |
|
|
|
|
|
|
|
|
Item 6. |
|
|
37 |
|
|
|
|
|
|
|
|
Item 7. |
|
Management’s Discussion and Analysis of Financial Condition and Results of Operations |
|
41 |
|
|
|
|
|
|
|
Item 7A. |
|
|
68 |
|
|
|
|
|
|
|
|
Item 8. |
|
|
70 |
|
|
|
|
|
|
|
|
Item 9. |
|
Changes in and Disagreements With Accountants on Accounting and Financial Disclosure |
|
133 |
|
|
|
|
|
|
|
Item 9A. |
|
|
133 |
|
|
|
|
|
|
|
|
Item 9B. |
|
|
133 |
|
|
|
|
|
|
|
|
|
|
|
|
|
|
|
|
|
|
|
|
Item 10. |
|
|
134 |
|
|
|
|
|
|
|
|
Item 11. |
|
|
134 |
|
|
|
|
|
|
|
|
Item 12. |
|
Security Ownership of Certain Beneficial Owners and Management and Related Stockholder Matters |
|
134 |
|
|
|
|
|
|
|
Item 13. |
|
Certain Relationships and Related Transactions, and Director Independence |
|
134 |
|
|
|
|
|
|
|
Item 14. |
|
|
134 |
|
|
|
|
|
|
|
|
|
|
|
|
|
|
|
|
|
|
|
|
Item 15. |
|
|
135 |
|
|
|
|
|
|
|
|
|
|
139 |
||
i
PART I
ITEM 1. BUSINESS.
Overview
Triumph Bancorp, Inc. (“we”, “Triumph” or the “Company”), is a financial holding company headquartered in Dallas, Texas and registered under the Bank Holding Company Act of 1956, as amended (the “BHC Act”). Through our wholly owned bank subsidiary, TBK Bank, SSB (“TBK Bank”), we offer traditional banking services, commercial finance product lines focused on businesses that require specialized financial solutions and national lending product lines that further diversify our lending operations. Our traditional banking offerings include a full suite of lending and deposit products and services focused on our local market areas. These activities generate a stable source of core deposits and a diverse asset base to support our overall operations. Our commercial finance product lines generate attractive returns and include factoring, asset-based lending, and equipment lending products offered nationally and across a variety of industries, with a focus on the transportation industry. Our national lending product lines provide further asset base diversification and include mortgage warehouse, liquid credit, and premium finance offered on a nationwide basis. We believe our integrated business model distinguishes us from other banks and non-bank financial services companies in the markets in which we operate. As of December 31, 2019, we had consolidated total assets of $5.060 billion, total loans held for investment of $4.195 billion, total deposits of $3.790 billion and total stockholders’ equity of $636.6 million.
Our business is conducted through three reportable segments (Banking, Factoring, and Corporate). For the year ended December 31, 2019, our banking segment generated 69% of our total revenue (comprised of interest and noninterest income), our factoring segment generated 30% of our total revenue, and our corporate segment generated 1% of our total revenue. On March 31, 2017, we sold our 100% membership interest in Triumph Capital Advisors, LLC (“TCA”) and discontinued fee based asset management services. TCA operations for the year ended December 31, 2017 are reflected in our Corporate segment, along with the gain on sale of our membership interest in TCA.
Principal Products and Services
Community Banking
Our community banking products and services include a variety of traditional banking services offered through our bank subsidiary, TBK Bank. These products and services focus on serving the local communities in which we operate and creating full banking relationships with both personal and commercial clients.
TBK Bank operates retail branch networks in three geographic markets, (i) a mid-western division consisting of ten branches in the Quad Cities Metropolitan Area of Iowa and Illinois, together with seven other branches throughout central and northwestern Illinois and one branch in northeastern Illinois, (ii) a western division consisting of thirty branches located throughout central and eastern Colorado and two branches in far western Kansas, and (iii) a mountain division consisting of seven branches in southern Colorado and three branches in New Mexico. Through this branch network, we offer our customers a variety of financial products and services that both augment our revenue (fee and interest income) and help us expand and retain our core deposit network, including checking and savings accounts, debit cards, and electronic banking. We also operate one location in Dallas, Texas, in which we maintain our corporate office and operate a branch that is dedicated to deposit gathering activities. We plan to open a new full service branch in Dallas, Texas during the first half of 2020. Our Dallas corporate office also serves as the center for our treasury management operations, which offers full service commercial banking functionality. Our treasury management operations generate fee income for us, while also enhancing our core deposit portfolio, as we are able to offer our commercial lending clients a full service banking relationship meeting all of their business needs.
We originate a full suite of commercial and retail loans including commercial real estate loans, construction and development loans, residential real estate loans, commercial agriculture, general commercial loans, and consumer loans primarily focused on customers in and around our community banking markets. These loan types include the following:
Commercial Real Estate Loans. We originate real estate loans to finance commercial property that is owner-occupied as well as commercial property owned by real estate investors. The real estate securing our existing commercial real estate loans includes a wide variety of property types, such as office buildings, warehouses, production facilities, hotels and mixed-use residential/commercial and multifamily properties. We originate these loans both in our community banking markets and on a nationwide basis.
Commercial Construction, Land and Land Development Loans. We offer loans to small-to-mid-sized businesses to construct owner-occupied properties, as well as loans to developers of commercial real estate investment properties and residential developments. These loans are typically disbursed as construction progresses and carry interest rates that vary with the prime rate. In certain instances, these loans can be converted to commercial real estate loans upon completion of their associated projects.
1
Residential Real Estate Loans. We originate first and second mortgage loans to our individual customers primarily for the purchase of primary and secondary residences, with a focus on offering these loans as an additional product to customers in our retail banking markets. We made the determination to recommence offering loans of this type in 2018 in order to further augment our product offerings and enhance overall customer experience.
Agriculture Loans. We originate a variety of loans to borrowers in the agriculture industry, including (i) real estate loans secured by farmland, (ii) equipment financing for specific agriculture equipment, including irrigation systems, (iii) crop input loans primarily focused on corn, wheat and soybeans, and (iv) loans secured by cattle and other livestock. We originate these loans primarily in the areas surrounding our community banking markets in Iowa, Illinois, Colorado, New Mexico, and Kansas.
Commercial Loans. We offer commercial loans to small-to-mid-sized businesses across a variety of industries. These loans include general commercial and industrial loans, loans to purchase capital equipment and business loans for working capital and operational purposes.
Consumer Loans. We also originate personal loans for our retail banking customers. These loans originate exclusively out of our community banking operations in Texas, Iowa, Illinois, Colorado, New Mexico, and Kansas.
Commercial Finance
Our commercial finance products and services focus on serving clients requiring more specialized financial products and services on a national basis and across a variety of industries, with a particular focus on clients in the transportation industry. Our commercial finance products and services also include our TriumphPay platform and our insurance brokerage activities, which seek to further expand the product suite we are able to offer to clients in the transportation industry.
The combination of the commercial finance products we are able to offer our clients in the transportation industry, specifically over the road trucking, when coupled together with our other products and services, such as personal and small business checking, treasury management, and premium finance lending, position us to provide a complete suite of products and services to this market, ranging from owner-operators to sizable fleets, that we believe is unique in the market in which we operate.
Factored Receivables. We offer factoring services to our customers across a variety of industries, with a focus in transportation factoring. In contrast to a lending relationship, in a factoring transaction we directly purchase the receivables generated by our clients at a discount to their face value. These transactions are structured to provide our clients with immediate liquidity to meet operating expenses when there is a mismatch between payments to our client for a good or service and the incurrence of operating costs required to provide such good or service. For example, in the transportation industry, invoices are typically paid 30 to 60 days after delivery whereas the truckers providing such transportation services require immediate funds to pay for fuel and other operating costs.
Our transportation factoring clients include small owner-operator trucking companies (one-to-four trucks), mid-sized fleets (5-to-50 trucks) and freight broker relationships whereby we manage all carrier payments on behalf of a broker client. Factoring for transportation businesses constituted approximately 77% of our total factoring portfolio at December 31, 2019, calculated based on the gross receivables from the purchase of invoices from such trucking businesses compared to our total gross receivables in the purchase of factored receivables as of such date. The features and pricing of our transportation factoring relationships vary by client type. Typically our smaller owner-operator relationships are structured as “non-recourse” relationships (i.e., we retain the credit risk associated with the ability of the account debtor on an invoice we purchase to ultimately make payment) and our larger relationships are structured as “recourse” relationships (i.e., our client agrees to repurchase from us any invoices for which payment is not ultimately received from the account debtor).
Our non-transportation factoring business targets small businesses with annual sales between $1 million and $50 million in industries such as manufacturing, distribution, and staffing.
Equipment Loans. We originate equipment loans primarily secured by new or used revenue producing, essential-use equipment from major manufacturers that is movable, may be used in more than one type of business, and generally has broad resale markets. Core markets include transportation, construction, and waste. Our equipment loans are typically fully amortizing, fixed rate loans secured by the underlying collateral with a term of three to five years. Equipment lending to transportation clients constituted approximately 75% of our total equipment lending portfolio as of December 31, 2019. Equipment loans are reported within commercial loans in the notes to our consolidated financial statements.
2
Asset-Based Loans. We originate asset-based loans to borrowers to support general working capital needs. Our asset-based loan structure involves advances of loan proceeds against a “borrowing base,” which typically consists of accounts receivable, identified readily marketable inventory or other collateral of the borrower. The maximum amount a customer may borrow at any time is fixed as a percentage of the asset borrowing base. These loans typically bear interest at a floating rate comprised of LIBOR or the prime rate plus a premium and include certain other transaction fees, such as origination and unused line fees. We target asset-based loan facilities between $1 million and $20 million and originate asset-based loans across a variety of industries. Asset-based loans are reported within commercial loans in the notes to our consolidated financial statements.
Triumph Pay. As an additional commercial finance product and service in the transportation and logistics industries where we have substantial factoring expertise, we offer our TriumphPay platform as a payments solution to freight broker and shipper clients. TriumphPay is a proprietary software platform that connects freight brokers and shippers with carriers to facilitate carrier payments. This platform provides both fee income to us and generates additional factored receivables in our loan portfolio, as carriers registered on the platform may be offered a “Quick Pay” option whereby we offer to purchase their invoice at discount in exchange for payment in advance of the normal payment terms for such invoice.
Triumph Insurance Group. We provide insurance brokerage services through Triumph Insurance Group, an agency primarily focused on meeting the insurance needs of our commercial finance clients, particularly our factoring clients in the transportation industry and our equipment lending clients.
National Lending
Our national lending products include mortgage warehouse, liquid credit, and premium finance loans. These national lending products and services are offered on a nationwide basis and provide further asset diversification within our loan portfolio.
Mortgage Warehouse Facilities. Mortgage warehouse arrangements allow unaffiliated mortgage originators to close one-to-four family real estate loans in their own name and manage their cash flow needs until the loans are sold to investors. Although not bound by any legally binding commitment, when a purchase decision is made, we purchase a 100% interest in the mortgage loans originated by our mortgage banking company customers using a Purchase/Repurchase agreement. The mortgage banking company customer closes mortgage loans consistent with underwriting standards established by the Agencies (FNMA, FHLMC and GNMA) and approved investors and, once all pertinent documents are received, the mortgage note is delivered by the Company to the investor selected by the originator.
The mortgage warehouse customers are located across the U.S. and originate loans primarily through traditional retail, wholesale and correspondent business models. These customers are strategically targeted for their experienced management teams and thoroughly analyzed to ensure long-term and profitable business models. By using this approach, we believe that this type of lending carries a lower risk profile than other one-to-four family mortgage loans held for investment in our portfolio, due to the short-term nature (averaging less than 30 days) of the exposure and the additional strength offered by the mortgage originator sponsorship.
At December 31, 2019, maximum aggregate outstanding purchases ranged in size from $10 million to $150 million. Typical covenants include minimum tangible net worth, maximum leverage and minimum liquidity. As loans age, the Company requires loan curtailments to reduce our risk involving loans that are not purchased by investors on a timely basis.
At December 31, 2019, the Company had 17 mortgage banking company customers with a maximum aggregate exposure of $970 million and an actual aggregate outstanding balance of $668 million. The average mortgage loan being purchased by the Company reflects a blend of both Conforming and Government loan characteristics, including an average loan to value ratio (LTV) of 84%, an average credit score of 712 and an average loan size of $230,769. These characteristics illustrate the low risk profile of loans purchased under the mortgage warehouse arrangements. To date, we have not experienced a loss on any of our mortgage warehouse loans. Through our commercial banking and treasury management functionality, we are able to offer our mortgage warehouse clients depository relationships focused on the servicing deposits generated in such businesses, further enhancing our core deposit portfolio.
Liquid Credit Loans. During 2019, we began purchasing broadly syndicated leveraged loans secured by a variety of collateral types. Given the highly liquid nature of these products, we are able to opportunistically scale this loan portfolio over time depending on opportunities in the syndicated loan market and other areas of our business. Liquid credit loans are reported within commercial loans in the notes to our consolidated financial statements.
Premium Finance Loans. We originate premium finance loans that provide customized premium financing solutions for the acquisition of property and casualty insurance coverage. In effect, these short term premium finance loans allow insureds to pay their insurance premiums over the life of the underlying policy, instead of paying the entire premium at the outset. Premium finance loans are reported within commercial loans in the notes to our consolidated financial statements.
3
Credit Risk Management
We mitigate credit risk through disciplined underwriting of each transaction we originate, as well as active credit management processes and procedures to manage risk and minimize loss throughout the life of a transaction. We seek to maintain a broadly diversified loan portfolio in terms of type of customer, type of loan product, geographic area and industries in which our business customers are engaged. We have developed tailored underwriting criteria and credit management processes for each of the various loan product types we offer our customers.
Underwriting
In evaluating each potential loan relationship, we adhere to a disciplined underwriting evaluation process including the following:
|
|
• |
understanding of the customer’s financial condition and ability to repay the loan; |
|
|
• |
verifying that the primary and secondary sources of repayment are adequate in relation to the amount and structure of the loan; |
|
|
• |
observing appropriate loan to value guidelines for collateral secured loans; |
|
|
• |
maintaining our targeted levels of diversification for the loan portfolio, including industry, collateral, geography, and product type; and |
|
|
• |
ensuring that each loan is properly documented with perfected liens on collateral. |
Our non-owner occupied commercial real estate loans are generally secured by income producing property with adequate margins, supported by a history of profitable operations and cash flows and proven operating stability in the case of commercial loans. Our commercial real estate loans and commercial loans are often supported by personal guarantees from the principals of the borrower.
With respect to our asset-based loans, in addition to an overall evaluation of the borrower and the transaction considering the applicable criteria set forth above, we also engage in an evaluation of the assets comprising the borrowing base for such loans, to confirm that such assets are readily recoverable and recoverable at rates in excess of the advance rate for such loans.
Our factoring relationships in particular require a specialized underwriting process. For each factoring transaction, in addition to a credit evaluation of our client, we also evaluate the creditworthiness of underlying account debtors, because account debtors represent the substantive underlying credit risk. Transportation factoring also presents the additional challenge of underwriting high volumes of invoices of predominantly low value per invoice and managing credit requests for a large industry pool of account debtors. We facilitate this process through a proprietary web-based “Online Broker Credit” application, which processes invoice purchase approval requests for our clients through an online proprietary scoring model and delivers either preliminary responses for small dollar requests or immediate referral to our servicing personnel for larger dollar requests. We also set and monitor concentration limits for individual account debtors that are tracked across all of our clients (as multiple clients may have outstanding invoices from a particular account debtor).
Our bank implements its underwriting evaluation and approval process through a tiered system of loan authorities. Under these authorities, transactions at certain identified levels are eligible to be approved by a designated officer or a combination of designated officers. Transactions above such individual thresholds require approval of a management-level loan committee. Transactions above the approval levels for our management-level loan committee must be approved by an executive loan committee comprised of directors of TBK Bank. Our underwriting and approval processes also employ limits we believe to be appropriate as to loan type and category, loan size, and other attributes.
Ongoing Credit Risk Management
We also perform ongoing risk monitoring and review processes for all credit exposures. Although we grade and classify our loans internally, we have an independent third party professional firm perform regular loan reviews to confirm loan classification. We strive to identify potential problem loans early in an effort to seek resolution of these situations before the loans create a loss, record any necessary charge-offs promptly and maintain adequate allowance levels for probable loan losses incurred in the loan portfolio. In general, whenever a particular loan or overall borrower relationship is downgraded to pass-watch or substandard based on one or more standard loan grading factors, our credit officers engage in active evaluation of the asset to determine the appropriate resolution strategy. Management regularly reviews the status of the watch list and classified assets portfolio as well as the larger credits in the portfolio.
4
In addition to our general credit risk management processes, we employ specialized risk management processes and procedures for certain of our commercial finance products, in particular our asset-based lending and factoring products. With respect to our asset-based lending relationships, we generally require dominion over the borrower’s cash accounts in order to actively control and manage the cash flows from the conversion of borrowing base collateral into cash and its application to the loan. We also engage in active review and monitoring of the borrowing base collateral itself, including field audits typically conducted on a 90-180 day cycle.
With respect to our factoring operations, we employ a proprietary risk management program whereby each client is assigned a risk score based on measurable criteria. Our risk model is largely geared toward early detection and mitigation of fraud, which we believe represents the most material risk of loss in this asset class. Risk scores are presented on a daily basis through a proprietary software application. These risk scores are then used to assign such client into a particular classification level. The classification level is not a predictor of loss exposure but rather the determinant for monitoring levels and servicing protocols, such as the percentage requirements for collateral review and invoice verification prior to purchase. This scoring and risk allocation methodology helps us to manage and control fraud and credit risk.
Marketing
We market our loans and other products and services through a variety of channels. Fundamentally, we focus on a high-touch direct sales model and building long-term relationships with our customers. In our community banking markets, our lending officers actively solicit new and existing businesses in the communities we serve. For our commercial finance product lines, we typically maintain sales personnel across the country with designated regional responsibilities for clients within their territories. We market our products and services through secondary channels, including e-marketing and search engine optimization, as well as key strategic sourcing relationships. Importantly, while we seek to ensure that the pricing on all of our loans and factoring products is competitive, we also attempt to distinguish ourselves with our clients on criteria other than price, including service, industry knowledge and a more complete value proposition than our competitors. We believe that our suite of complementary commercial finance product options and our other available banking services, including treasury management services and our insurance brokerage initiatives, allow us to offer full-service banking relationships to clients and industries that have historically been served by smaller non-bank commercial finance companies.
Deposits
Deposits are our primary source of funds to support our earning assets. We offer depository products, including checking, savings, money market and certificates of deposit with a variety of rates. Deposits at our bank subsidiary are insured by the Federal Deposit Insurance Corporation (“FDIC”) up to statutory limits. In addition, required deposit balances associated with our commercial loan arrangements and treasury management relationships maintained by our commercial lending clients provide an additional source of deposits. In our community banking markets, we have a network of 60 deposit-taking branch offices. We also maintain a branch office in Dallas, Texas, dedicated to deposit generation activities.
Competitors
The bank and non-bank financial services industries in our markets and the surrounding areas are highly competitive. We compete with a wide range of regional and national banks located in our market areas as well as non-bank commercial finance and factoring companies on a nationwide basis. We experience competition in both lending and attracting funds from commercial banks, savings associations, credit unions, consumer finance companies, pension trusts, mutual funds, insurance companies, mortgage bankers and brokers, brokerage and investment banking firms, non-bank lenders, government agencies and certain other non-financial institutions. Many of these competitors have more assets, capital and lending limits, and resources than we do and may be able to conduct more intensive and broader-based promotional efforts to reach both commercial and individual customers. Competition for deposit products can depend heavily on pricing because of the ease with which customers can transfer deposits from one institution to another.
Supervision and Regulation
Banking is a complex, highly regulated industry. Consequently, our growth and earnings performance can be affected, not only by management decisions and general and local economic conditions, but also by the statutes administered by and the regulations and policies of, various governmental regulatory authorities. These authorities include, but are not limited to, the Federal Reserve, the FDIC, the Texas Department of Savings and Mortgage Lending (“TDSML”), the Internal Revenue Service (“IRS”), and state taxing authorities. The effect of these statutes, regulations and policies and any changes to any of them can be significant and cannot be predicted.
5
The primary goals of the bank regulatory scheme are to maintain a safe and sound banking system and to facilitate the conduct of sound monetary policy. In furtherance of those goals, the U.S. Congress and the individual states have created numerous regulatory agencies and enacted numerous laws, such as the Dodd-Frank Act, that govern banks and the banking industry. The system of supervision and regulation applicable to the Company establishes a comprehensive framework for our operations and is intended primarily for the protection of the FDIC’s deposit insurance funds, our depositors and the public, rather than the stockholders and creditors.
New regulations and statutes are regularly proposed that contain wide-ranging proposals for altering the structures, regulations and competitive relationships of financial institutions operating in the United States. The federal banking agencies have issued a number of significant new regulations as a result of the Dodd-Frank Act and a number of additional regulations are pending or may be proposed. We cannot predict whether or in what form any proposed regulation or statute will be adopted or the extent to which any of our businesses may be affected by any new regulation or statute.
The following is an attempt to summarize some of the relevant laws, rules and regulations governing banks and bank holding companies, but does not purport to be a complete summary of all applicable laws, rules and regulations governing banks. The descriptions are qualified in their entirety by reference to the specific statutes and regulations discussed.
Bank Holding Company Regulation
The Company is a financial holding company registered under the BHC Act and is subject to supervision and regulation by the Federal Reserve. Federal laws subject bank holding companies to particular restrictions on the types of activities in which they may engage and to a range of supervisory requirements and activities, including regulatory enforcement actions, for violation of laws and policies.
Activities Closely Related to Banking
The BHC Act prohibits a bank holding company, with certain limited exceptions, from acquiring direct or indirect ownership or control of any voting shares of any company that is not a bank or from engaging in any activities other than those of banking, managing or controlling banks and certain other subsidiaries or furnishing services to or performing services for its subsidiaries. Bank holding companies also may engage in or acquire interests in companies that engage in a limited set of activities that are closely related to banking or managing or controlling banks. If a bank holding company has become a financial holding company (an “FHC”), as we have, it may engage in a broader set of activities, including insurance underwriting and broker-dealer services as well as activities that are jointly determined by the Federal Reserve and the U.S. Treasury to be financial in nature or incidental to such financial activity. FHCs may also engage in activities that are determined by the Federal Reserve to be complementary to financial activities. The Company has elected to be an FHC. To maintain FHC status, the bank holding company and all subsidiary depository institutions must be well managed and “well capitalized.” Additionally, all subsidiary depository institutions must have received at least a “Satisfactory” rating on their most recent Community Reinvestment Act (“CRA”) examination. Failure to meet these requirements may result in limitations on activities and acquisitions.
Safe and Sound Banking Practices
Bank holding companies are not permitted to engage in unsafe and unsound banking practices. The Federal Reserve may order a bank holding company to terminate an activity or control of a non-bank subsidiary if such activity or control constitutes a significant risk to the financial safety, soundness or stability of a subsidiary bank and is inconsistent with sound banking principles.
Consistent with the Dodd-Frank Act codification of the Federal Reserve’s policy that bank holding companies must serve as a source of financial strength for their subsidiary banks, the Federal Reserve has stated that, as a matter of prudence, a bank holding company generally should not maintain a rate of distributions to stockholders unless its available net income has been sufficient to fully fund the distributions and the prospective rate of earnings retention appears consistent with a bank holding company’s capital needs, asset quality and overall financial condition. In addition, we are subject to certain restrictions on the making of distributions as a result of the requirement that our subsidiary bank maintains an adequate level of capital as described below. Limitations on our subsidiary bank paying dividends could, in turn, affect our ability to pay dividends to our stockholders. For more information concerning our subsidiary bank’s ability to pay dividends, see below.
6
In addition, the Federal Reserve Supervisory Letter SR 09-4 provides guidance on the declaration and payment of dividends, capital redemptions and capital repurchases by a bank holding company. Supervisory Letter SR 09-4 provides that, as a general matter, a bank holding company should eliminate, defer or significantly reduce its dividends if: (i) the bank holding company’s net income available to stockholders for the past four quarters, net of dividends previously paid during that period, is not sufficient to fully fund the dividends, (ii) the bank holding company’s prospective rate of earnings retention is not consistent with the bank holding company’s capital needs and overall current and prospective financial condition or (iii) the bank holding company will not meet, or is in danger of not meeting, its minimum regulatory capital adequacy ratios. Failure to do so could result in a supervisory finding that the bank holding company is operating in an unsafe and unsound manner. Capital rules and their implementing regulations also require a holding company to get the prior approval of the Federal Reserve prior to any redemption or repurchase of certain of its own equity securities.
The Federal Reserve has broad authority to prohibit activities of bank holding companies and their non-banking subsidiaries which represent unsafe and unsound banking practices or which constitute violations of laws or regulations. Notably, the Financial Institutions Reform, Recovery and Enforcement Act of 1989 (“FIRREA”) provides that the Federal Reserve Board can assess civil money penalties for such practices or violations which can be as high as $1 million per day. FIRREA contains expansive provisions regarding the scope of individuals and entities against which such penalties may be assessed.
Annual Reporting and Examinations
The Company is required to file annual and quarterly reports with the Federal Reserve and such additional information as the Federal Reserve may require pursuant to the BHC Act. The Federal Reserve may examine a bank holding company or any of its subsidiaries and charge the bank holding company for the cost of such an examination. The Company is also subject to reporting and disclosure requirements under state and federal securities laws.
Rules on Regulatory Capital
Regulatory capital rules pursuant to the Basel III requirements, released in July 2013, implemented higher minimum capital requirements for bank holding companies and banks effective on January 1, 2015. The rules include a common equity Tier 1 capital requirement and establish criteria that instruments must meet to be considered common equity Tier 1 capital, additional Tier 1 capital or Tier 2 capital. These enhancements were designed to both improve the quality and increase the quantity of capital required to be held by banking organizations, better equipping the U.S. banking system to deal with adverse economic conditions. The capital rules require banks and bank holding companies to maintain a minimum common equity Tier 1 (“CET1”) capital ratio of 4.5%, a total Tier 1 capital ratio of 6%, a total capital ratio of 8% and a leverage ratio of 4%. Bank holding companies are also required to hold a capital conservation buffer of CET1 capital of 2.5% to avoid limitations on capital distributions and executive compensation payments. Under the rules, bank holding companies must maintain a total risk-based capital ratio of 10% and a total Tier 1 risk-based capital ratio of 6% to be considered “well capitalized” for purposes of certain rules and requirements.
The capital rules also require banks to maintain a CET1 capital ratio of 6.5%, a total Tier 1 capital ratio of 8%, a total capital ratio of 10% and a leverage ratio of 5% to be deemed “well capitalized” for purposes of certain rules and prompt corrective action requirements. The risk-based ratios include a “capital conservation buffer” of 2.5%. The capital conservation buffer requirement began being phased in during January 2016 at 0.625% of risk-weighted assets and increased by that amount each year until it was fully implemented in January 2019. An institution is subject to limitations on certain activities including payment of dividends, share repurchases and discretionary bonuses to executive officers if its capital level is below the buffer amount. This buffer will help to ensure that banking organizations conserve capital when it is most needed, allowing them to better weather periods of economic stress.
The regulatory capital rules attempt to improve the quality of capital by implementing changes to the definition of capital. Among the most important changes are stricter eligibility criteria for regulatory capital instruments that would disallow the inclusion of instruments, such as trust preferred securities, in Tier 1 capital going forward and new constraints on the inclusion of minority interests, mortgage-servicing assets, deferred tax assets and certain investments in the capital of unconsolidated financial institutions. In addition, the rules require that most regulatory capital deductions be made from common equity Tier 1 capital.
The Federal Reserve may also set higher capital requirements for holding companies whose circumstances warrant it. For example, holding companies experiencing internal growth or making acquisitions are expected to maintain strong capital positions substantially above the minimum supervisory levels, without significant reliance on intangible assets. At this time, the bank regulatory agencies are more inclined to impose higher capital requirements to meet well-capitalized standards and future regulatory change could impose higher capital standards as a routine matter. The Company’s regulatory capital ratios and those of its subsidiary bank are in excess of the levels established for “well-capitalized” institutions under the rules.
7
The regulatory capital rules also set forth certain changes in the methods of calculating certain risk-weighted assets, which in turn affects the calculation of risk-based ratios. Under the rules, higher or more sensitive risk weights are assigned to various categories of assets, including, certain credit facilities that finance the acquisition, development or construction of real property, certain exposures or credits that are 90 days past due or on nonaccrual, foreign exposures and certain corporate exposures. In addition, the rules include (i) alternative standards of credit worthiness consistent with the Dodd-Frank Act, (ii) greater recognition of collateral and guarantees and (iii) revised capital treatment for derivatives and repo-style transactions.
In addition, the rules include certain exemptions to address concerns about the regulatory burden on community banks. For example, banking organizations with less than $15 billion in consolidated assets as of December 31, 2009 are permitted to include in Tier 1 capital trust preferred securities and cumulative perpetual preferred stock issued and included in Tier 1 capital prior to May 19, 2010 on a permanent basis, without any phase out. Community banks were also able to elect on a one time basis in their March 31, 2015 quarterly filings to opt-out of the requirement to include most accumulated other comprehensive income (“AOCI”) components in the calculation of CET1 capital and, in effect, retain the AOCI treatment under the current capital rules. Under the rules, we elected to make the one-time permanent election to continue to exclude AOCI from capital.
Imposition of Liability for Undercapitalized Subsidiaries
The Federal Deposit Insurance Corporation Improvement Act of 1991 (“FDICIA”) required each federal banking agency to revise its risk-based capital standards to ensure that those standards take adequate account of interest rate risk, concentration of credit risk and the risks of nontraditional activities, as well as reflect the actual performance and expected risk of loss on multifamily mortgages.
As discussed above, in accordance with the law, each federal banking agency has specified, by regulation, the levels at which an insured institution would be considered “well capitalized,” adequately capitalized, undercapitalized, significantly undercapitalized and critically undercapitalized. As of December 31, 2019, the Company’s subsidiary bank exceeded the capital levels required to be deemed “well capitalized.”
Additionally, FDICIA requires bank regulators to take prompt corrective action to resolve problems associated with insured depository institutions. In the event an institution becomes undercapitalized, it must submit a capital restoration plan.
Under these prompt corrective action provisions of FDICIA, if a controlled bank is undercapitalized, then the regulators could require the bank to submit a capital restoration plan. If an institution becomes significantly undercapitalized or critically undercapitalized, additional and significant limitations are placed on the institution. The capital restoration plan of an undercapitalized institution will not be accepted by the regulators unless each company having control of the undercapitalized institution guarantees the subsidiary’s compliance with the capital restoration plan until it becomes adequately capitalized. The Company has control of its subsidiary bank for the purpose of this statute.
Further, by statute and regulation, a bank holding company must serve as a source of financial and managerial strength to each bank that it controls and, under appropriate circumstances, may be required to commit resources to support each such controlled bank. This support may be required at times when the bank holding company may not have the resources to provide the support. In addition, if the Federal Reserve believes that a bank holding company’s activities, assets or affiliates represent a significant risk to the financial safety, soundness or stability of a controlled bank, then the Federal Reserve could require the bank holding company to terminate the activities, liquidate the assets or divest the affiliates. The regulators may require these and other actions in support of controlled banks even if such actions are not in the best interests of the bank holding company or its stockholders.
Acquisitions by Bank Holding Companies
The BHC Act requires every bank holding company to obtain the prior approval of the Federal Reserve before it may acquire all or substantially all of the assets of any bank or ownership or control of any voting shares of any bank if after such acquisition it would own or control, directly or indirectly, more than 5% of the voting shares of such bank. In approving bank acquisitions by bank holding companies, the Federal Reserve is required to consider the financial and managerial resources and future prospects of the bank holding company and banks concerned, the convenience and needs of the communities to be served, the effect on competition as well as the financial stability of the United States. The Attorney General of the United States may, within 30 days after approval of an acquisition by the Federal Reserve, bring an action challenging such acquisition under the federal antitrust laws, in which case the effectiveness of such approval is stayed pending a final ruling by the courts. Under certain circumstances, the 30-day period may be shortened to 15 days.
8
Control Acquisitions
The Change in Bank Control Act (“CBCA”) prohibits a person or group of persons from acquiring “control” of a bank holding company unless the Federal Reserve has been notified and has not objected to the transaction. Under a rebuttable presumption established by the Federal Reserve, the acquisition of 10% or more of a class of voting stock of a bank holding company with a class of securities registered under Section 12 of the Exchange Act, such as the Company, would, under the circumstances set forth in the presumption, constitute acquisition of control of the Company.
In addition, the CBCA prohibits any entity from acquiring 25% (the BHC Act has a lower limit for acquirers that are existing bank holding companies) or more of a bank holding company’s or bank’s voting securities, or otherwise obtaining control or a controlling influence over a bank holding company or bank without the approval of the Federal Reserve. On January 31, 2020, the Federal Reserve Board approved the issuance of a final rule (which becomes effective April 1, 2020) that clarifies and codifies the Federal Reserve’s standards for determining whether one company has control over another. The final rule establishes four categories of tiered presumptions of noncontrol that are based on the percentage of voting shares held by the investor (less than 5%, 5-9.9%, 10-14.9% and 15-24.9%) and the presence of other indicia of control. As the percentage of ownership increases, fewer indicia of control are permitted without falling outside of the presumption of noncontrol. These indicia of control include nonvoting equity ownership, director representation, management interlocks, business relationship and restrictive contractual covenants. Under the final rule, investors can hold up to 24.9% of the voting securities and up to 33% of the total equity of a company without necessarily having a controlling influence.
Anti-Tying Restrictions
Bank holding companies and their affiliates are prohibited from tying the provision of certain services, such as extensions of credit, to other services offered by a holding company or its affiliates.
Bank Regulation
TBK Bank
TBK Bank is a Texas state savings bank and is subject to various requirements and restrictions under the laws of the United States and Texas and to regulation, supervision and regular examination by the FDIC and the TDSML. TBK Bank is required to file reports with the FDIC and the TDSML concerning its activities and financial condition in addition to obtaining regulatory approvals before entering into certain transactions such as mergers with, or acquisitions of, other financial institutions. The regulators have the power to enforce compliance with applicable banking statutes and regulations. Those regulations include requirements to maintain reserves against deposits, restrictions on the nature and amount of loans that may be made and the interest that may be charged on loans and restrictions relating to investments and other activities of TBK Bank.
Standards for Safety and Soundness
As part of FDICIA’s efforts to promote the safety and soundness of depository institutions and their holding companies, appropriate federal banking regulators are required to have in place regulations specifying operational and management standards (addressing internal controls, loan documentation, credit underwriting and interest rate risk), asset quality and earnings. As discussed above, the Federal Reserve and the FDIC have extensive authority to police unsafe or unsound practices and violations of applicable laws and regulations by depository institutions and their holding companies. For example, the FDIC may terminate the deposit insurance of any institution that it determines has engaged in an unsafe or unsound practice. The agencies can also assess civil money penalties of up to $1 million per day, issue cease-and-desist or removal orders, seek injunctions and publicly disclose such actions.
The ability of TBK Bank, as a Texas state savings bank, to pay dividends is restricted under the Texas Finance Code. Pursuant to the Texas Finance Code, a Texas state savings bank may declare and pay a dividend out of current or retained earnings, in cash or additional stock, to the holders of record of the stock outstanding on the date the dividend is declared. However, without the prior approval of the TDSML, a cash dividend may not be declared by the board of a Texas state savings bank that the TDSML considers to be in an unsafe condition or to have less than zero total retained earnings on the date of the dividend declaration.
TBK Bank is also subject to certain restrictions on the payment of dividends as a result of the requirement that it maintain an adequate level of capital in accordance with guidelines promulgated from time to time by the federal regulators.
The present and future dividend policy of TBK Bank is subject to the discretion of its board of directors. In determining whether to pay dividends to Triumph and, if made, the amount of the dividends, the board of directors of TBK Bank considers many of the same factors discussed above. TBK Bank cannot guarantee that it will have the financial ability to pay dividends to Triumph, or if dividends are paid, that they will be sufficient for Triumph to make distributions to stockholders. TBK Bank is not obligated to pay dividends.
9
Restrictions on Transactions with Affiliates
Section 23A of the Federal Reserve Act imposes quantitative and qualitative limits on transactions between a bank and any affiliate and requires certain levels of collateral for such loans. It also limits the amount of advances to third parties which are collateralized by the securities or obligations of the Company. Section 23B of the Federal Reserve Act requires that certain transactions between the Company’s subsidiary bank and its affiliates must be on terms substantially the same, or at least as favorable, as those prevailing at the time for comparable transactions with or involving other nonaffiliated companies. In the absence of such comparable transactions, any transaction between the bank and its affiliates must be on terms and under circumstances, including credit standards, which in good faith would be offered to or would apply to nonaffiliated companies.
Capital Adequacy
In addition to the capital rules applicable to both banks and bank holding companies discussed above, under the prompt corrective action regulations, the federal bank regulators are required and authorized to take supervisory actions against undercapitalized banks. For this purpose a bank is placed in one of the following five categories based on the bank’s capital:
|
|
• |
well-capitalized (at least 5% leverage capital, 6.5% common equity Tier 1 risk-based capital, 8% Tier 1 risk-based capital and 10% total risk-based capital); |
|
|
• |
adequately capitalized (at least 4% leverage capital, 4.5% common equity Tier 1 risk-based capital, 6% Tier 1 risk-based capital and 8% total risk-based capital); |
|
|
• |
undercapitalized (less than 4% leverage capital, 4.5% common equity Tier 1 risk-based capital, 6% Tier 1 risk-based capital and 8% total risk-based capital); |
|
|
• |
significantly undercapitalized (less than 3% leverage capital, 3% common equity Tier 1 risk-based capital, 4% Tier 1 risk-based capital and 6% total risk-based capital); and |
|
|
• |
critically undercapitalized (less than 2% tangible capital). |
Federal banking regulators are required to take various mandatory supervisory actions and are authorized to take other discretionary actions with respect to institutions in the three undercapitalized categories. The severity of the action depends upon the capital category in which the institution is placed. Generally, subject to a narrow exception, banking regulators must appoint a receiver or conservator for an institution that is “critically undercapitalized.” The federal banking agencies have specified by regulation the relevant capital level for each category. An institution that is categorized as “undercapitalized,” “significantly undercapitalized,” or “critically undercapitalized” is required to submit an acceptable capital restoration plan to its appropriate federal banking agency.
Failure to meet capital guidelines could subject our subsidiary bank to a variety of enforcement remedies, including issuance of a capital directive, the termination of deposit insurance by the FDIC, a prohibition on accepting brokered deposits and other restrictions on our business.
Deposit Insurance
The FDIC insures the deposits of federally insured banks up to prescribed statutory limits for each depositor, through the Deposit Insurance Fund (“DIF”) and safeguards the safety and soundness of the banking and thrift industries. The amount of FDIC assessments paid by each insured depository institution is based on its relative risk of default as measured by regulatory capital ratios and other supervisory factors.
The FDIC’s deposit insurance premium assessment is based on an institution’s average consolidated total assets minus average tangible equity.
We are generally unable to control the amount of premiums that we are required to pay for FDIC insurance. At least semi-annually, the FDIC will update its loss and income projections for the DIF and, if needed, will increase or decrease assessment rates, following notice-and-comment rulemaking, if required. If there are additional bank or financial institution failures or if the FDIC otherwise determines to increase assessment rates, TBK Bank may be required to pay higher FDIC insurance premiums. Any future increases in FDIC insurance premiums may have a material and adverse effect on our earnings.
10
Consumer Financial Protection Bureau
The Consumer Financial Protection Bureau (“CFPB”) is granted broad rulemaking, supervisory and enforcement powers under various federal consumer financial protection laws, including the Equal Credit Opportunity Act, Truth in Lending Act, Real Estate Settlement Procedures Act, Fair Credit Reporting Act, Fair Debt Collection Act, the Consumer Financial Privacy provisions of the Gramm-Leach-Bliley Act and certain other statutes. The CFPB has examination and primary enforcement authority with respect to depository institutions with $10 billion or more in assets. Depository institutions with less than $10 billion in assets, such as our subsidiary depository institution, are subject to rules promulgated by the CFPB, which may increase their compliance risk and the costs associated with their compliance efforts, but the banks will continue to be examined and supervised by federal banking regulators for consumer compliance purposes. The CFPB has authority to prevent unfair, deceptive or abusive practices in connection with the offering of consumer financial products.
The CFPB has issued regulatory guidance and has proposed, or will be proposing, regulations on issues that directly relate to our business. Although it is difficult to predict the full extent to which the CFPB’s final rules impact the operations and financial condition of our subsidiary bank, such rules may have a material impact on the bank’s compliance costs, compliance risk and fee income.
Privacy
Under the Right to Financial Privacy Act, which imposes a duty to maintain confidentiality of consumer financial records and prescribes procedures for complying with administrative subpoenas of financial records, financial institutions are required to disclose their policies for collecting and protecting confidential information. Customers generally may prevent financial institutions from sharing personal financial information with nonaffiliated third parties except for third parties that market the institutions’ own products and services. Additionally, financial institutions generally may not disclose consumer account numbers to any nonaffiliated third party for use in telemarketing, direct mail marketing or other marketing through electronic mail to consumers.
The Patriot Act, International Money Laundering Abatement and Financial Anti-Terrorism Act and Bank Secrecy Act
A major focus of governmental policy on financial institutions has been aimed at combating money laundering and terrorist financing. The Patriot Act and the International Money Laundering Abatement and Financial Anti-Terrorism Act of 2001 substantially broadened the scope of U.S. anti-money laundering laws and penalties, specifically related to the Bank Secrecy Act and expanded the extra-territorial jurisdiction of the United States. The U.S. Treasury has issued a number of implementing regulations which apply various requirements of the Patriot Act to financial institutions such as TBK Bank. These regulations impose obligations on financial institutions to maintain appropriate policies, procedures and controls to detect, prevent and report money laundering and terrorist financing and to verify the identity of their customers.
Failure of a financial institution and its holding company to maintain and implement adequate programs to combat money laundering and terrorist financing, or to comply with relevant laws and regulations, could have serious legal, reputational and financial consequences for the institution. Because of the significance of regulatory emphasis on these requirements, TBK Bank will continue to expend significant staffing, technology and financial resources to maintain programs designed to ensure compliance with applicable laws and regulations and an effective audit function for testing of the bank’s compliance with the Bank Secrecy Act on an ongoing basis.
Community Reinvestment Act
The CRA requires that, in connection with examinations of financial institutions within its jurisdiction, the FDIC and the state banking regulators, as applicable, evaluate the record of each financial institution in meeting the credit needs of its local community, including low and moderate-income neighborhoods. These facts are also considered in evaluating mergers, acquisitions and applications to open a branch or facility. Failure to adequately meet these criteria could impose additional requirements and limitations on us. Additionally, we must publicly disclose the terms of various CRA-related agreements.
Qualified Thrift Lender
As a Texas state savings bank, TBK Bank is required to meet a Qualified Thrift Lender (“QTL”) test to avoid certain restrictions on its activities. TBK Bank is currently, and expects to remain, in compliance with QTL standards.
Other Regulations
Interest and other charges that our subsidiary bank collects or contracts for are subject to state usury laws and federal laws concerning interest rates.
11
Our bank’s loan operations are also subject to federal laws applicable to credit transactions, such as:
|
|
• |
the federal Truth-In-Lending Act, governing disclosures of credit terms to consumer borrowers; |
|
|
• |
the Home Mortgage Disclosure Act, requiring financial institutions to provide information to enable the public and public officials to determine whether a financial institution is fulfilling its obligation to help meet the housing needs of the community it serves; |
|
|
• |
the Equal Credit Opportunity Act, prohibiting discrimination on the basis of race, creed or other prohibited factors in extending credit; |
|
|
• |
the Fair Credit Reporting Act, governing the use and provision of information to credit reporting agencies; |
|
|
• |
the Fair Debt Collection Act, governing the manner in which consumer debts may be collected by collection agencies; and |
|
|
• |
the rules and regulations of the various governmental agencies charged with the responsibility of implementing these federal laws. |
In addition, our subsidiary bank’s deposit operations are subject to the Electronic Funds Transfer Act and Regulation E issued by the Federal Reserve to implement that act, which govern automatic deposits to and withdrawals from deposit accounts and customers’ rights and liabilities arising from the use of automated teller machines and other electronic banking services.
Concentrated Commercial Real Estate Lending Regulations
The Federal Reserve and other federal banking regulatory agencies promulgated guidance governing financial institutions with concentrations in commercial real estate lending. The guidance provides that a bank has a concentration in commercial real estate lending if (i) total reported loans for construction, land development and other land represent 100% or more of total capital or (ii) total reported loans secured by multifamily and non-farm residential properties and loans for construction, land development and other land represent 300% or more of total capital and the bank’s commercial real estate loan portfolio has increased 50% or more during the prior 36 months. If a concentration is present, management must employ heightened risk management practices including board and management oversight and strategic planning, development of underwriting standards, risk assessment and monitoring through market analysis and stress testing and increasing capital requirements.
All of the above laws and regulations add significantly to the cost of operating the Company and our subsidiary depository institution and thus have a negative impact on profitability. We would also note that there has been a tremendous expansion experienced in recent years by certain financial service providers that are not subject to the same rules and regulations as the Company and our subsidiary depository institution. These institutions, because they are not so highly regulated, have a competitive advantage over us and our subsidiary depository institution and may continue to draw large amounts of funds away from banking institutions, with a continuing adverse effect on the banking industry in general.
Effect of Governmental Monetary Policies
The commercial banking business is affected not only by general economic conditions but also by both U.S. fiscal policy and the monetary policies of the Federal Reserve. Some of the instruments of fiscal and monetary policy available to the Federal Reserve include changes in the discount rate on member bank borrowings, the fluctuating availability of borrowings at the “discount window,” open market operations, the imposition of and changes in reserve requirements against member banks’ deposits and assets of foreign branches, the imposition of and changes in reserve requirements against certain borrowings by banks and their affiliates and the placing of limits on interest rates that member banks may pay on time and savings deposits. Such policies influence to a significant extent the overall growth of bank loans, investments and deposits and the interest rates charged on loans or paid on time and savings deposits. We cannot predict the nature of future fiscal and monetary policies and the effect of such policies on future business and our earnings.
Employees
As of December 31, 2019, we had 1,107 full-time equivalent employees. None of our employees are represented by any collective bargaining unit or are a party to a collective bargaining agreement.
12
Available Information
The Company’s internet address is www.triumphbancorp.com. The Company makes available at this address, free of charge, its annual report on Form 10-K, its annual reports to stockholders, quarterly reports on Form 10-Q, current reports on Form 8-K and amendments to those reports filed or furnished pursuant to Section 13(a) or 15(d) of the Securities Exchange Act of 1934 (the “Exchange Act”) as soon as reasonably practicable after such material is electronically filed with, or furnished to, the Securities and Exchange Commission (the “SEC”). These documents are also available on the SEC’s website at www.sec.gov.
13
ITEM 1A. RISK FACTORS.
Our business and results of operations are subject to numerous risks and uncertainties, many of which are beyond our control. The material risks and uncertainties that management believes affect the Company are described below. Additional risks and uncertainties that management is not aware of or that management currently deems immaterial may also impair the Company’s business operations. This report is qualified in its entirety by these risk factors. If any of the following risks actually occur, our business, financial condition and results of operations could be materially and adversely affected. If this were to happen, the value of our securities could decline significantly, and you could lose all or part of your investment. Some statements in the following risk factors constitute forward-looking statements. Please refer to “Cautionary Note Regarding Forward-Looking Statements” in Item 7 of this report.
Risks Relating to Our Business
As a business operating in the bank and non-bank financial services industries, our business and operations may be adversely affected in numerous and complex ways by weak economic conditions.
As a business operating in the bank and non-bank financial services industries, our business and operations are sensitive to general business and economic conditions in the United States. If the U.S. economy weakens, our growth and profitability from our lending, deposit and asset management services could be constrained. Uncertainty about the federal fiscal policymaking process, the medium and long-term fiscal outlook of the federal and state governments (including possible ratings downgrades) and future tax rates (or other amendments to the Internal Revenue Code of 1986, as amended (the “Code”) or to state tax laws) is a concern for businesses, consumers and investors in the United States. In addition, economic conditions in foreign countries, including uncertainty over the stability of the Euro and Chinese Yuan currencies, could affect the stability of global financial markets, which could hinder U.S. economic growth. Weak national economic conditions are characterized by deflation, fluctuations in debt and equity capital markets, a lack of liquidity and/or depressed prices in the secondary market for mortgage loans, increased delinquencies on mortgage, consumer and commercial loans, residential and commercial real estate price declines and lower home sales and commercial activity. The current economic environment is also characterized by interest rates at historically low levels, and our ability to retain or grow our deposit base could be hindered by higher market interest rates in the future. All of these factors may be detrimental to our business and the interplay between these factors can be complex and unpredictable. Our business is also significantly affected by monetary and related policies of the U.S. federal government and its agencies. Changes in any of these policies are influenced by macroeconomic conditions and other factors that are beyond our control. Adverse economic conditions and government policy responses to such conditions could have an adverse effect on our business, financial condition and results of operations.
We may be adversely affected by the soundness of other financial institutions.
Our ability to engage in routine funding transactions could be adversely affected by the actions and commercial soundness of other financial institutions. Bank and non-bank financial services companies are interrelated as a result of trading, clearing, counterparty and other relationships. We have exposure to different industries and counterparties and through transactions with counterparties in the bank and non-bank financial services industries, including brokers and dealers, commercial banks, investment banks and other institutional clients. As a result, defaults by, or even rumors or questions about, one or more bank or non-bank financial services companies, or the bank or non-bank financial services industries generally, have led to market-wide liquidity problems and could lead to losses or defaults by us or by other institutions. These losses or defaults could have an adverse effect on our business, financial condition and results of operations.
We rely heavily on our management team and could be adversely affected by the unexpected loss of key officers.
We are led by an experienced core management team with substantial experience in the markets that we serve and the financial products that we offer. Our operating strategy focuses on providing products and services through long-term relationship managers. Accordingly, our success depends in large part on the performance of our key personnel, as well as on our ability to attract, motivate and retain highly qualified senior and middle management. Competition for employees is intense, and the process of locating key personnel with the combination of skills and attributes required to execute our business plan may be lengthy. We may not be successful in retaining our key employees and the unexpected loss of services of one or more of our key personnel could have a material adverse effect on our business because of their skills, knowledge of our market and financial products, years of industry experience, long-term customer relationships and the difficulty of promptly finding qualified replacement personnel. If the services of any of our key personnel should become unavailable for any reason, we may not be able to identify and hire qualified persons on terms acceptable to us, which could have an adverse effect on our business, financial condition and results of operations.
14
We are subject to interest rate risk, which could adversely affect our financial condition and profitability.
The majority of our banking assets and liabilities are monetary in nature and subject to risk from changes in interest rates. Like most financial institutions, our earnings are significantly dependent on our net interest income, the principal component of our earnings, which is the difference between interest earned by us from our interest earning assets, such as loans and investment securities, and interest paid by us on our interest bearing liabilities, such as deposits and borrowings. We expect that we will periodically experience “gaps” in the interest rate sensitivities of our assets and liabilities, meaning that either our interest bearing liabilities will be more sensitive to changes in market interest rates than our interest earning assets, or vice versa. In either event, if market interest rates should move contrary to our position, this “gap” will negatively impact our earnings. The impact on earnings is more adverse when the slope of the yield curve flattens, that is, when short term interest rates increase more than long-term interest rates or when long-term interest rates decrease more than short term interest rates. Many factors impact interest rates, including governmental monetary policies, inflation, recession, changes in unemployment, the money supply and international disorder and instability in domestic and foreign financial markets.
Interest rate increases often result in larger payment requirements for our borrowers, which increases the potential for default. At the same time, the marketability of the property securing a loan may be adversely affected by any reduced demand resulting from higher interest rates. In a declining interest rate environment, there may be an increase in prepayments on loans as borrowers refinance their loans at lower rates. Changes in interest rates also can affect the value of loans, securities and other assets. An increase in interest rates that adversely affects the ability of borrowers to pay the principal or interest on loans may lead to an increase in nonperforming assets and a reduction of income recognized, which could have a material adverse effect on our results of operations and cash flows. Further, when we place a loan on nonaccrual status, we reverse any accrued but unpaid interest receivable, which decreases interest income. At the same time, we continue to have a cost to fund the loan, which is reflected as interest expense, without any interest income to offset the associated funding expense. Thus, an increase in the amount of nonperforming assets would have an adverse impact on net interest income. If short term interest rates continue to remain at their historically low levels for a prolonged period and assuming longer-term interest rates fall further, we could experience net interest margin compression as our interest earning assets would continue to reprice downward while our interest bearing liability rates could fail to decline in tandem. Such an occurrence would have an adverse effect on our net interest income and could have an adverse effect on our business, financial condition and results of operations.
We may be adversely impacted by the transition from LIBOR as a reference rate
In 2017, the United Kingdom’s Financial Conduct Authority announced that after 2021 it would no longer compel banks to submit the rates required to calculate the London Interbank Offered Rate (“LIBOR”). This announcement indicates that the continuation of LIBOR on the current basis cannot and will not be guaranteed after 2021. Consequently, at this time, it is not possible to predict whether and to what extent banks will continue to provide submissions for the calculation of LIBOR. Similarly, it is not possible to predict whether LIBOR will continue to be viewed as an acceptable market benchmark, what rate or rates may become accepted alternatives to LIBOR, or what the effect of any such changes in views or alternatives may be on the markets for LIBOR-indexed financial instruments.
In particular, regulators, industry groups and certain committees (e.g., the Alternative Reference Rates Committee) have, among other things, published recommended fall-back language for LIBOR-linked financial instruments, identified recommended alternatives for certain LIBOR rates (e.g., the Secured Overnight Financing Rate as the recommended alternative to U.S. Dollar LIBOR), and proposed implementations of the recommended alternatives in floating rate instruments. At this time, it is not possible to predict whether these specific recommendations and proposals will be broadly accepted, whether they will continue to evolve, and what the effect of their implementation may be on the markets for floating-rate financial instruments.
We have loans, borrowings and other financial instruments with attributes that are either directly or indirectly dependent on LIBOR. The transition from LIBOR could create considerable costs and additional risk. Since proposed alternative rates are calculated differently, payments under contracts referencing new rates will differ from those referencing LIBOR. The transition will change our market risk profiles, requiring changes to risk and pricing models, valuation tools, and product design. Furthermore, failure to adequately manage this transition process with our customers could adversely impact our reputation. Although we are currently unable to assess what the ultimate impact of the transition from LIBOR will be, failure to adequately manage the transition could have a material adverse effect on our business, financial condition and results of operations.
15
New lines of business or new products and services may subject us to additional risks. A failure to successfully manage these risks may have a material adverse effect on our business.
As part of our growth strategy, we have implemented and may continue to implement new lines of business, offer new products and services within our existing lines of business or shift the focus to our asset mix. There are substantial risks and uncertainties associated with these efforts, particularly in instances where such product lines are not fully mature. In developing and marketing new lines of business and/or new products and services and/or shifting the focus of our asset mix, we may invest significant time and resources. Initial timetables for the introduction and development of new lines of business and/or new products or services may not be achieved and price and profitability targets may not prove feasible. External factors, such as compliance with regulations, competitive alternatives and shifting market preferences, may also impact the successful implementation of a new line of business or a new product or service. Furthermore, any new line of business and/or new product or service could have a significant impact on the effectiveness of our system of internal controls. Failure to successfully manage these risks in the development and implementation of new lines of business or new products or services could have an adverse effect on our business, financial condition and results of operations.
A substantial portion of our business is concentrated in the transportation industry and economic conditions or other factors negatively impacting the transportation industry could adversely affect our business and operations.
A substantial portion of our revenues are derived from the transportation industry, including our transportation factoring business, our TriumphPay operations, and our equipment finance lending focusing on the transportation sector. Given the concentration of such businesses in the transportation industry, economic conditions or other factors that negatively impact the transportation industry could impact our revenues, expose us to an increased risk of fraud or credit loss, or otherwise negatively impact our business. For example, reductions in economic activity reducing the volume of goods in commerce, changes in the spot rate market for transportation, and other factors impacting carriers in the over the road transportation business, such as the cost of insurance, may influence both the size of invoices we are able to purchase in our transportation business (both in traditional factoring as well as Quick Pay transactions being originated through TriumphPay) as well as the number of carriers engaged in this business and their utilization of available capacity. Negative trends in such items will directly correlate with a reduction in our net funds employed from transportation factored receivables and with reduced revenues from our factoring and TriumphPay operations. In addition, as negative factors in the transportation industry induce more financial stress on our clients in such businesses, we may experience an increased number of defaults in our equipment finance and other loans focused on this industry, as well as an increased risk of fraud, particularly in our factoring operations. For the year ended December 31, 2019, we estimate that 30 – 35 percent of our revenues were derived from the transportation industry, and as of December 31, 2019, 77% of our period end factored receivables portfolio consisted of invoices purchased from transportation clients. Growth of our businesses focused on the transportation industry, in particular our transportation factoring and TriumphPay operations, are a key strategic focus for the Company. The occurrence of any of such events as described above resulting from factors negatively impacting the transportation industry may have an adverse effect on our strategic plans, business, financial condition and results of operations.
Additional regulations and rule making impacting the transportation industry may have a disproportionate impact on the small-to-mid-sized trucking businesses that comprise our primary transportation factoring clients and adversely affect our factoring business.
Our primary transportation factoring clients are small-to-mid-sized owner-operators and trucking fleets. Recently implemented federal regulations, and regulations proposed to be implemented in the future, may significantly increase the costs and expenses or reduce the ability to generate revenue associated with owning or operating a trucking fleet. These regulations include rule making proposed by the Federal Motor Carrier Safety Administration of the United States Department of Transportation (“FMCSA”) under the Compliance, Safety, Accountability (“CSA”) initiative, maximum hours of service limitations imposed by the FMCSA, electronic log requirements, and regulations proposed by the federal Food and Drug Administration (“FDA”) requiring increased labeling and monitoring by carriers of any commodity transported that is regulated by the FDA. The costs and burdens of compliance with these requirements will have a disproportionate impact on the small-to-mid-sized trucking businesses that comprise our client base and may force some or all of these businesses out of the market. Such an occurrence could impact the returns we realize on our factoring activity or result in a decrease in the overall amount of our factoring activity and could have an adverse effect on our business, financial condition and results of operations.
16
Our asset-based lending and factoring products may expose us to an increased risk of fraud.
We rely on the structural features embedded in our asset-based lending and factoring products to mitigate the credit risk associated with such products. With respect to our asset-based loans, we limit our lending to a percentage of the customer’s borrowing base assets that we believe can be readily liquidated in the event of financial distress of the borrower. With respect to our factoring products, we purchase the underlying invoices of our customers and become the direct payee under such invoices, thus transferring the credit risk in such transactions from our customers to the underlying account debtors on such invoices. In the event one or more of our customers fraudulently represents the existence or valuation of borrowing base assets in the case of an asset-based loan, or the existence or validity of an invoice we purchase in the case of a factoring transaction, we may advance more funds to such customer than we otherwise would and lose the benefit of the structural protections of our products with respect to such advances. In such event we could be exposed to material additional losses with respect to such loans or factoring products. Although we believe we have controls in place to monitor and detect fraud with respect to our asset-based lending and factoring products, there is no guarantee such controls will be effective. We have experienced fraud with respect to these products in the past and we anticipate that we will experience such fraud in the future. Losses from such fraudulent activity could have a material impact on our business, financial condition and results of operations.
Our commercial finance clients, particularly with respect to our factoring and asset-based lending product lines, may lack the operating history, cash flows or balance sheet necessary to support other financing options and may expose us to additional credit risk, especially if our additional controls for such products are ineffective in mitigating such additional risks.
A significant portion of our loan portfolio consists of commercial finance products. Some of these commercial finance products, particularly asset-based loans and our factored receivables, arise out of relationships with clients who lack the operating history, cash flows or balance sheet necessary to qualify for other financing options. We attempt to control for the additional credit risk in these relationships through credit management processes employed in connection with these transactions. However, if such controls are ineffective in controlling this additional risk or if we fail to follow the procedures we have established for managing this additional risk, we could be exposed to additional losses with respect to such product lines that could have an adverse effect on our business, financial condition and results of operations.
Our agriculture loans may expose us to risk of credit defaults due to changes in commodity prices.
Our agriculture loans generally consist of (i) real estate loans secured by farmland, (ii) equipment financing for specific agriculture equipment, including irrigation systems, (iii) crop input loans primarily focused on corn, wheat and soybeans, and (iv) loans secured by cattle and other livestock. Decreases in commodity prices, such as currently impacting the agriculture industry, may negatively affect both the cash flows of the borrowers and the value of the collateral supporting such loans. Although we attempt to account for the possibility of such commodity price fluctuations in underwriting, structuring and monitoring our agriculture loans, there is no guarantee that efforts will be successful and we may experience increased delinquencies or defaults in this portfolio or be required to increase our provision for loan losses, which could have an adverse effect on our business, financial condition and results of operations.
The growth in our TriumphPay operations may expose us to additional risks that could adversely affect our business and operations.
Our TriumphPay business, a software payments solution that links freight broker and shipper clients with carriers in the transportation industry, has experienced significant year over year growth. Annual payments processed through the platform were $328.4 million for the fiscal year ended December 31, 2018 and $975.1 million for the fiscal year ended December 31, 2019, an increase of $646.7 million. Growth of our TriumphPay platform is a key strategic focus for the Company and we anticipate that growth in this product will continue during this and future fiscal years. Such growth in the volume of transactions being processed through this platform may expose us to operational and other risks, as this software platform consists of newly developed technology that is subject to continuous and ongoing innovation and improvement. Should such software fail to operate as designed, the transactions scheduled to be processed through the system may not be consummated as intended and we may be exposed to financial and reputational risks. We are also subject to risks that competitors may develop, or continue to develop existing, technologies that compete with us. Such competitive products may be deemed by our current or potential future clients to be superior to our TriumphPay product, and such competitive products may improve and innovate faster than we are able to improve and innovate TriumphPay, in which event we may be subject to reduced adoption of TriumphPay going forward, as well as the loss of existing clients on the platform.
17
In addition, our TriumphPay operations consist of us making a significant volume of invoice payments on behalf of individual broker and shipper clients, and we may have exposure related to the financial solvency of such entities, particularly to the extent we directly acquire the invoices of such entities through engaging in QuickPay transactions with the carrier payees in such transactions. Although we have historically had this type of credit exposure to account debtors for transportation invoices due to our transportation factoring operations, our exposures of this type, related to TriumphPay clients, may be more concentrated given the volume of payments we will handle for such individual TriumphPay clients, as well as the overlap with additional invoices of such entities purchased in our traditional transportation factoring operations. Although we actively monitor our concentration exposures to such entities on an aggregate basis, a failure of such TriumphPay freight broker or shipper clients may expose us to a greater risk of loss than we have historically been subject to given our concentrations with such entities.
Lack of seasoning in portions of our loan portfolio could increase risk of credit defaults in the future.
As a result of our growth over the past several years, certain portions of our loan portfolio are of relatively recent origin. Loans may not begin to show signs of credit deterioration or default until they have been outstanding for some period of time, a process referred to as “seasoning.” As a result, a portfolio of older loans will usually behave more predictably than a newer portfolio. Because such portions of our portfolio are relatively new, the current level of delinquencies and defaults may not represent the level that may prevail as the portfolio becomes more seasoned. If delinquencies and defaults increase, we may be required to increase our provision for loan losses, which could have an adverse effect on our business, financial condition and results of operations.
We may not be able to adequately measure and limit the credit risk associated with our loan portfolio, our business and financial condition, which could adversely affect profitability.
As a part of our products and services, we make commercial and commercial real estate loans. The principal economic risk associated with each class of loans is the creditworthiness of the borrower, which is affected by the strength of the relevant business market segment, local market conditions and general economic conditions. Additional factors related to the credit quality of commercial loans include the quality of the management of the business and the borrower’s ability both to properly evaluate changes in the supply and demand characteristics affecting our market for products and services and to effectively respond to those changes. Additional factors related to the credit quality of commercial real estate loans include tenant vacancy rates and the quality of management of the property. A failure to effectively measure and limit the credit risk associated with our loan portfolio could have an adverse effect on our business, financial condition and results of operations.
The small-to-mid-sized businesses that comprise a material portion of our loan portfolio may have fewer resources to weather a downturn in the economy, which may impair a borrower’s ability to repay a loan to us, which could materially harm our operating results.
A significant element of our growth strategy involves offering our commercial finance products to small-to-mid-sized businesses. These small-to-mid-sized businesses frequently have smaller market share than their competition, may be more vulnerable to economic downturns, often need substantial additional capital to expand or compete and may experience significant volatility in operating results. Any one or more of these factors may impair the borrower’s ability to repay a loan. In addition, the success of a small-to-mid-sized business often depends on the management talents and efforts of one or two persons or a small group of persons and the death, disability or resignation of one or more of these persons could have a material adverse impact on the business and its ability to repay a loan. Economic downturns and other events that negatively impact our market areas could cause us to incur substantial credit losses that could have an adverse effect on our business, financial condition and results of operations.
Our concentration of large loans to certain borrowers may increase our credit risk.
While we attempt to monitor the concentration of our loan portfolio by borrower, geography and industry, we nonetheless may have concentrations in these areas that increase the risk to our loan portfolio resulting from adverse changes impacting such borrowers, geographies or industries. For example, we have made a significant number of large loans to a small number of borrowers, resulting in a concentration of large loans to these borrowers. Consequently, we may have significant exposure if any of these borrowers becomes unable to pay their loan obligations as a result of economic or market conditions, or personal circumstances, such as divorce or death. In addition, a large portion of our loans are made in our community banking markets of Iowa, Illinois, Colorado, New Mexico, and Kansas and in Texas, the home of our corporate headquarters and the majority of our commercial finance operations. We also have lending concentrations in industries such as transportation, construction and energy services. As a result, the performance of our portfolio could be adversely impacted by economic or market conditions affecting these geographies or industries, such as the impact of falling oil prices on the energy services industry specifically or the Texas economy more generally, all of which could have an adverse effect on our business, financial condition and results of operations.
18
The amount of our nonperforming assets may increase significantly, resulting in additional losses and costs and expenses that will negatively affect our operations.
At December 31, 2019, we had a total of approximately $44.1 million of nonperforming assets or approximately 0.87% of total assets. Should the amount of nonperforming assets increase in the future, we may incur losses and the costs and expenses to maintain such assets likewise can be expected to increase and potentially negatively affect earnings. Any additional increase in losses due to such assets could have an adverse effect on our business, financial condition and results of operations. Such effects may be particularly pronounced in a market of reduced real estate values and excess inventory.
The amount of other real estate owned (“OREO”) may increase significantly, resulting in additional losses and costs and expenses that will negatively affect our operations.
At December 31, 2019, the amount of OREO we held totaled $3.0 million. In the event the amount of OREO should increase due to an increase in defaults on bank loans, our losses and the costs and expenses to maintain the real estate, likewise would increase. Any additional increase in losses and maintenance costs and expenses due to OREO may have a material adverse effect on our business, financial condition and results of operations. Such effects may be particularly pronounced in a market of reduced real estate values and excess inventory, which may make the disposition of OREO properties more difficult, increase maintenance costs and expenses and may reduce our ultimate realization from any OREO sales, which could have an adverse effect on our business, financial condition and results of operations.
Nonperforming assets take significant time and resources to resolve and adversely affect our results of operations and financial condition.
Nonperforming assets adversely affect our net income in various ways. We generally do not record interest income on nonperforming loans or OREO, thereby adversely affecting our income and increasing loan administration costs. When we take collateral in foreclosures and similar proceedings, we are required to mark the related asset to the then fair value of the collateral less estimated selling costs, which may ultimately result in a loss. An increase in the level of nonperforming assets increases our risk profile and may impact the capital levels regulators believe are appropriate in light of the ensuing risk profile. While we reduce problem assets through loan workouts, restructurings and otherwise, decreases in the value of the underlying collateral, or in these borrowers’ performance or financial condition, whether or not due to economic and market conditions beyond our control, could have an adverse effect on our business, financial condition and results of operations. In addition, the resolution of nonperforming assets requires significant commitments of time from management, which may materially and adversely impact their ability to perform their other responsibilities. There can be no assurance that we will not experience future increases in nonperforming assets.
Our ALLL may prove to be insufficient to absorb potential losses in our loan portfolio, which may adversely affect our business, financial condition and results of operations.
ALLL is a valuation allowance for probable incurred credit losses. Loan losses are charged against the allowance when management believes the uncollectability of a loan balance is confirmed. Subsequent recoveries, if any, are credited to the allowance. Management estimates the allowance balance required using past loan loss experience, the nature and volume of the portfolio, information about specific borrower situations and estimated collateral values, economic conditions and other factors. The provision for loan losses is charged against earnings in order to maintain our ALLL and reflects management’s best estimate of probable incurred losses inherent in our loan portfolio at the balance sheet date.
As of December 31, 2019, our ALLL as a percentage of total loans was 0.69% and as a percentage of total nonperforming loans was 71.63%. Additional loan losses will likely occur in the future and may occur at a rate greater than we have previously experienced. We may be required to take additional provisions for loan losses in the future to further supplement our ALLL, either due to management’s decision to do so or requirements by our banking regulators. In addition, bank regulatory agencies will periodically review our ALLL and the value attributed to nonaccrual loans or to real estate acquired through foreclosure. Such regulatory agencies may require us to recognize future charge-offs. These adjustments could have an adverse effect on our business, financial condition and results of operations.
19
Further, the Financial Accounting Standards Board has adopted a new accounting standard that will be effective for our fiscal year beginning on January 1, 2020. This standard, referred to as ASU 2016-13, “Financial Instruments – Credit Losses (Topic 326): Measurement of Credit Losses on Financial Instruments” (“ASU 2016-13”), makes significant changes to the accounting for credit losses on financial instruments presented on an amortized cost basis, such as our loans held for investment, and disclosures about them. The new current expected credit loss (CECL) impairment model will require an estimate of expected credit losses, measured over the contractual life of an instrument, which considers reasonable and supportable forecasts of future economic conditions in addition to information about past events and current conditions. The standard provides significant flexibility and requires a high degree of judgment with regards to pooling financial assets with similar risk characteristics and adjusting the relevant historical loss information in order to develop an estimate of expected lifetime losses. Providing for losses over the life of our loan portfolio is a change to the previous method of providing allowances for loan losses that are probable and incurred. This change may require us to increase our allowance for loan losses rapidly in future periods, and greatly increases the types of data we need to collect and review to determine the appropriate level of the allowance for loan losses. It may also result in even small changes to future forecasts having a significant impact on the allowance, which could make the allowance more volatile, and regulators may impose additional capital buffers to absorb this volatility.
Acquisitions may disrupt our business and dilute stockholder value. We may not be able to overcome the integration, costs and other risks associated with our recently completed and possible future acquisitions, which could adversely affect our growth and profitability.
We have historically engaged in acquisitions and we may engage in acquisitions in the future. Such transactions have historically, and may in the future, involve substantial transaction expenses and expenses associated with integrating the operations of the acquired businesses with our operations. These expenses may exceed the savings that we expect to receive from the elimination of duplicative expenses and the realization of economies of scale. We may fail to realize some or all of the anticipated benefits of our previously completed and possible future acquisitions if the integration process for these acquisitions takes longer or is more costly than expected or otherwise fails to meet our expectations. Such integration processes will be a time-consuming and expensive process that could significantly disrupt our existing services, even if effectively and efficiently planned and implemented.
In addition, our acquisition activities could be material to our business and involve a number of risks, including the following:
|
|
• |
incurring time and expense associated with identifying and evaluating potential acquisitions and negotiating potential transactions, resulting in our attention being diverted from the operation of our existing business; |
|
|
• |
using inaccurate estimates and judgments to evaluate credit, operations, management, tax and market risks with respect to the target institution or assets; |
|
|
• |
exposure to potential asset quality issues of the target company; |
|
|
• |
intense competition from other banking organizations and other acquirers for acquisitions; |
|
|
• |
potential exposure to unknown or contingent liabilities of banks and businesses we acquire, including, without limitation, liabilities for regulatory and compliance issues; |
|
|
• |
inability to realize the expected revenue increases, cost savings, increases in geographic or product presence and other projected benefits of the acquisition; |
|
|
• |
the time and expense required to integrate the operations and personnel of the combined businesses; |
|
|
• |
experiencing higher operating expenses relative to operating income from the new operations; |
|
|
• |
creating an adverse short term effect on our results of operations; |
|
|
• |
losing key employees and customers; |
|
|
• |
significant problems relating to the conversion of the financial and customer data of the entity; |
|
|
• |
integration of acquired customers into our financial and customer product systems; |
|
|
• |
potential changes in banking or tax laws or regulations that may affect the target company; or |
|
|
• |
risks of impairment to goodwill or other than temporary impairment of investment securities. |
20
Depending on the condition of any institution or assets or liabilities that we may acquire, that acquisition may, at least in the near term, adversely affect our capital and earnings and, if not successfully integrated with our organization, may continue to have such effects over a longer period. We may not be successful in overcoming these risks or any other problems encountered in connection with potential acquisitions and any acquisition we may consider will be subject to prior regulatory approval. Our inability to overcome these risks could have an adverse effect on our profitability, return on equity and return on assets, our ability to implement our business strategy and enhance stockholder value, which, in turn, could have an adverse effect on our business, financial condition and results of operations.
Our acquisition history and any future acquisitions may make it difficult for investors to evaluate our business, financial condition and results of operations and also impairs our ability to accurately forecast our future performance.
We have grown historically through multiple acquisitions. On October 15, 2013, we acquired National Bancshares, Inc. and its banking subsidiary, THE National Bank, N.A., which represented a significant portion of our total operations immediately following such acquisition. On August 1, 2016, we completed our acquisition of ColoEast Bankshares, Inc. and its wholly owned subsidiary bank, Colorado East Bank & Trust. In 2017, we acquired nine branches in Colorado from Independent Bank Group, Inc.’s banking subsidiary, Independent Bank, on October 6, 2017, and we acquired Valley Bancorp, Inc. and its subsidiary bank, Valley Bank & Trust, effective December 9, 2017. In 2018, we acquired substantially all of the operating assets of, and assumed certain liabilities associated with, Interstate Capital Corporation’s accounts receivable factoring business and other related financial services on June 2, 2018, and we acquired First Bancorp of Durango, Inc. and its two community banking subsidiaries, The First National Bank of Durango and Bank of New Mexico, and Southern Colorado Corp. (“SCC”) and its community banking subsidiary, Citizens Bank of Pagosa Springs, effective September 8, 2018. In addition, we may engage in acquisitions in the future. Our previous acquisitions may make it more difficult for investors to evaluate historical trends in our financial results and operating performance, as the impact of such acquisitions make it more difficult to identify organic trends that would be reflected absent such acquisitions. Consequently, predictions and forecasts about our future revenue and expense may be impacted by future acquisitions, the terms of such acquisitions, and the specific attributes of the acquired companies, each of which are subject to factors outside of our control and which may vary materially depending on any future acquisition targets ultimately pursued. Thus, any predictions or forecasts about our future operations may not be as accurate as they would be if we were to grow purely on an organic basis.
A lack of liquidity could adversely affect our operations and jeopardize our business, financial condition and results of operations.
Liquidity is essential to our business. We rely on our ability to generate deposits and effectively manage the repayment and maturity schedules of our loans and investment securities, respectively, to ensure that we have adequate liquidity to fund our operations. An inability to raise funds through deposits, borrowings, the sale of our investment securities, Federal Home Loan Bank advances, the sale of loans and other sources could have a substantial negative effect on our liquidity. Our most important source of funds consists of deposits. Deposit balances can decrease when customers perceive alternative investments as providing a better risk/return tradeoff. If customers move money out of bank deposits and into other investments, we would lose a relatively low-cost source of funds, increasing our funding costs and reducing our net interest income and net income.
Other primary sources of funds consist of cash flows from operations, investment maturities and sales of investment securities and proceeds from the issuance and sale of our equity and debt securities to investors. Additional liquidity is provided by the ability to borrow from the Federal Home Loan Bank and our ability to raise brokered deposits. We also may borrow funds from third-party lenders, such as other financial institutions. Our access to funding sources in amounts adequate to finance or capitalize our activities, or on terms that are acceptable to us, could be impaired by factors that affect us directly or the bank or non-bank financial services industries or economy in general, such as disruptions in the financial markets or negative views and expectations about the prospects for the bank or non-bank financial services industries.
As of December 31, 2019, approximately $1.077 billion, or 28.4%, of our deposits consisted of interest bearing demand deposits and money market accounts. Based on past experience, we believe that our deposit accounts are relatively stable sources of funds. If we increase interest rates paid to retain deposits, our earnings may be adversely affected, which could have an adverse effect on our business, financial condition and results of operations.
Historically, our loan portfolio has grown at a faster rate than our ability to organically grow transactional deposits in our community banking markets, and we have offset this trend in part through acquiring additional banks with excess liquidity. We have recently expanded our efforts to grow transactional deposits organically. If our historical loan growth were to continue and we are unable to successfully grow transactional deposits organically or through mergers and acquisitions we will likely be required to rely on higher cost sources of funding, such as certificates of deposit, to fund continued loan growth, which could have an adverse effect on our business, financial condition and results of operations.
Any decline in available funding could adversely impact our ability to originate loans, invest in securities, meet our expenses, pay dividends to our stockholders or fulfill obligations such as repaying our borrowings or meeting deposit withdrawal demands, any of which could have a material adverse impact on our liquidity, business, financial condition and results of operations.
21
The fair value of our investment securities can fluctuate due to factors outside of our control and impairment of investment securities could require charges to earnings, which could result in a negative impact on our results of operations.
As of December 31, 2019, the fair value of our investment securities portfolio was approximately $261.2 million. Factors beyond our control can significantly influence the fair value of securities in our portfolio and can cause potential adverse changes to the fair value of these securities. These factors include, but are not limited to, rating agency actions in respect to the securities, defaults by the issuer or with respect to the underlying securities and changes in market interest rates and instability in the capital markets. Any of these factors, among others, could cause impairments and realized and/or unrealized losses in future periods and declines in other comprehensive income, which could have an adverse effect on our business, financial condition and results of operations.
ASU 2016-13, will change the impairment model for investment securities classified as available for sale (“AFS”). Under the new impairment model, an AFS investment security is considered impaired when it experiences a decline in fair value below its amortized cost basis. At each measurement date, we will determine how much of the decline in fair value below amortized cost basis is due to credit-related factors and how much of the decline is due to noncredit-related factors. Credit-related impairment will be recognized as an allowance on our balance sheet with a corresponding adjustment to earnings. Any impairment that is not credit related is recognized in other comprehensive income, net of applicable taxes.
Whether we establish an allowance for credit losses on an AFS investment security will depend on whether we expect to realize the total value of the security by collecting the contractual cash flows. The process for determining whether or not an AFS investment security’s decline in fair value below its amortized cost basis is credit-related will require complex, subjective judgments including, but not limited to, the extent to which the fair value is less than the amortized cost basis, any adverse conditions specifically related to the investment security (including changes to its industry and geographic area), the payment structure of the investment security, failure of the issuer of the investment security to make scheduled payments of principal and interest, and any changes to the rating of the investment security by a rating agency.
Impairment of goodwill, other intangible assets or deferred tax assets could require charges to earnings, which could result in a negative impact on our results of operations.
Under current accounting standards, goodwill is not amortized but, instead, is subject to impairment tests on at least an annual basis or more frequently if an event occurs or circumstances change that reduce the fair value of a reporting unit below its carrying amount. A decline in our stock price or occurrence of a triggering event following any of our quarterly earnings releases and prior to the filing of the periodic report for that period could, under certain circumstances, cause us to perform a goodwill impairment test and result in an impairment charge being recorded for that period which was not reflected in such earnings release. In the event that we conclude that all or a portion of our goodwill may be impaired, a non-cash charge for the amount of such impairment would be recorded to earnings. Such a charge would have no impact on tangible capital. At December 31, 2019, we had goodwill of $158.7 million, representing approximately 25% of total equity.
The Company's intangible assets primarily relate to core deposits and customer relationships. Intangible assets with definite useful lives are amortized on an accelerated basis over their estimated life. Intangible assets, premises and equipment and other long-lived assets are tested for impairment whenever events or changes in circumstances indicate the carrying amount of the assets may not be recoverable from future undiscounted cash flows. A triggering event following any of our quarterly earnings releases and prior to the filing of the periodic report for that period could, under certain circumstances, cause us to perform an intangible asset impairment test and result in an impairment charge being recorded for that period which was not reflected in such earnings release. In the event that we conclude that all or a portion of our intangible assets may be impaired, a non-cash charge for the amount of such impairment would be recorded to earnings. Such a charge would have no impact on tangible capital. At December 31, 2019, we had intangible assets of $31.5 million, representing approximately 5% of total equity.
In assessing the potential for realization of deferred tax assets, management considers whether it is more likely than not that some portion or all of the deferred tax assets will not be realized. Assessing the need for, or the sufficiency of, a valuation allowance requires management to evaluate all available evidence, both negative and positive, including the recent trend of quarterly earnings. Positive evidence necessary to overcome the negative evidence includes whether future taxable income in sufficient amounts and character within the carryback and carryforward periods is available under the tax law, including the use of tax planning strategies. When negative evidence (e.g., cumulative losses in recent years, history of operating loss or tax credit carryforwards expiring unused) exists, more positive evidence than negative evidence will be necessary. We have concluded that, based on the level of positive evidence, it is more likely than not that at December 31, 2019 all but $0.3 million which is recorded as a valuation allowance of the deferred tax asset will be realized. At December 31, 2019, net deferred tax assets were approximately $3.8 million. The impact of each of these impairment matters could have a material adverse effect on our business, results of operations and financial condition.
22
Our risk management strategies may not be fully effective in mitigating our risk exposures in all market environments or against all types of risk.
We have devoted significant resources to develop our risk management policies and procedures and expect to continue to do so in the future. Nonetheless, our risk management strategies may not be fully effective in mitigating our risk exposure in all market environments or against all types of risk, including risks that are unidentified or unanticipated. As our products and services change and grow and the markets in which we operate evolve, our risk management strategies may not always adapt to those changes. Some of our methods of managing risk are based upon our use of observed historical market behavior and management’s judgment. As a result, these methods may not predict future risk exposures, which could be significantly greater than the historical measures indicate. Management of market, credit, liquidity, operational, legal, regulatory and compliance risks requires, among other things, policies and procedures to record properly and verify a large number of transactions and events and these policies and procedures may not be fully effective. While we employ a broad and diversified set of risk monitoring and risk mitigation techniques, those techniques and the judgments that accompany their application cannot anticipate every economic and financial outcome or the timing of such outcomes. Any of these circumstances could have an adverse effect on our business, financial condition and results of operations.
Risks for environmental liability apply to the properties under consideration as well as properties that are contiguous or upgradient to the subject properties.
In the course of our business, we may purchase real estate in connection with a future acquisition, or we may foreclose on and take title to real estate that serves as collateral on loans we make. As a result, we could be subject to environmental liabilities with respect to those properties. We may be held liable to a governmental entity or to third parties for property damage, personal injury, investigation and clean-up costs incurred by these parties in connection with environmental contamination, or we may be required to investigate or clean up hazardous or toxic substances or chemical releases at a property. The costs associated with investigation or remediation activities could be substantial. In addition, if we are the owner or former owner of a contaminated site, we may be subject to common law claims by third parties based on damages and costs resulting from environmental contamination emanating from the property.
The cost of removal or abatement may not substantially exceed the value of the affected properties or the loans secured by those properties, that we may not have adequate remedies against the prior owners or other responsible parties and we may not be able to resell the affected properties either before or after completion of any such removal or abatement procedures. If material environmental problems are discovered before foreclosure, we generally will not foreclose on the related collateral or will transfer ownership of the loan to a subsidiary. It should be noted, however, that the transfer of the property or loans to a subsidiary may not protect us from environmental liability. Furthermore, despite these actions on our part, the value of the property as collateral will generally be substantially reduced and, as a result, we may suffer a loss upon collection of the loan. Currently, we are not a party to any legal proceedings involving potential liability to us under applicable environmental laws. Any significant environmental liabilities could have an adverse effect on our business, financial condition and results of operations.
We face significant competition to attract and retain customers, which could adversely affect our growth and profitability.
We operate in the highly competitive bank and non-bank financial services industries and face significant competition for customers from bank and non-bank competitors, particularly regional and nationwide institutions, including U.S. banks, mortgage banking companies, consumer finance companies, credit unions, insurance companies and other institutional lenders and purchasers of loans in originating loans, attracting deposits and providing other financial services. Many of our competitors are significantly larger and have significantly more resources, greater name recognition and more extensive and established branch networks than we do. Because of their scale, many of these competitors can be more aggressive than we can on loan and deposit pricing. Also, many of our non-bank competitors have fewer regulatory constraints and may have lower cost structures. We expect competition to continue to intensify due to financial institution consolidation; legislative, regulatory and technological changes; and the emergence of alternative banking sources.
Our ability to compete successfully will depend on a number of factors, including, among other things:
|
|
• |
our ability to build and maintain long-term customer relationships while ensuring high ethical standards and safe and sound banking practices; |
|
|
• |
the scope, relevance and pricing of products and services that we offer; |
|
|
• |
customer satisfaction with our products and services; |
|
|
• |
industry and general economic trends; and |
|
|
• |
our ability to keep pace with technological advances and to invest in new technology. |
23
Increased competition could require us to increase the rates that we pay on deposits or lower the rates that we offer on loans, which could reduce our profitability. Our failure to compete effectively in our market could restrain our growth or cause us to lose market share, which could have an adverse effect on our business, financial condition and results of operations.
The accuracy of our financial statements and related disclosures could be affected if the judgments, assumptions or estimates used in our critical accounting policies are inaccurate.
The preparation of financial statements and related disclosure in conformity with GAAP requires us to make judgments, assumptions and estimates that affect the amounts reported in our consolidated financial statements and accompanying notes. Our critical accounting policies, which are included in Item 7 of this report captioned “Management’s Discussion and Analysis of Financial Condition and Results of Operations”, describe those significant accounting policies and methods used in the preparation of our consolidated financial statements that we consider “critical” because they require judgments, assumptions and estimates that materially affect our consolidated financial statements and related disclosures. As a result, if future events differ significantly from the judgments, assumptions and estimates in our critical accounting policies, those events or assumptions could have a material impact on our consolidated financial statements and related disclosures.
Additionally, as a result of our past acquisitions, our financial results are heavily influenced by the application of the acquisition method of accounting. The acquisition method of accounting requires management to make assumptions regarding the assets purchased and liabilities assumed to determine their fair value. If our assumptions are incorrect, any resulting change or modification could have an adverse effect on our business, financial condition and results of operations.
If we fail to correct any material weakness that we subsequently identify in our internal control over financial reporting or otherwise fail to maintain effective internal control over financial reporting, we may not be able to report our financial results accurately and timely, in which case our business may be harmed, investors may lose confidence in the accuracy and completeness of our financial reports and the price of our common stock may decline.
Our management is responsible for establishing and maintaining adequate internal control over financial reporting and for evaluating and reporting on our system of internal control. Our internal control over financial reporting is a process designed to provide reasonable assurance regarding the reliability of financial reporting and the preparation of financial statements for external purposes in accordance with GAAP. As a public company, we are required to comply with the Sarbanes-Oxley Act and other rules that govern public companies. In particular, we are required to certify our compliance with Section 404 of the Sarbanes-Oxley Act, which requires us to furnish annually a report by management on the effectiveness of our internal control over financial reporting. In addition, our independent registered public accounting firm is required to report on the effectiveness of our internal control over financial reporting.
If we identify material weaknesses in our internal control over financial reporting in the future, if we cannot comply with the requirements of the Sarbanes-Oxley Act in a timely manner or attest that our internal control over financial reporting is effective, or if our independent registered public accounting firm cannot express an opinion as to the effectiveness of our internal control over financial reporting when required, we may not be able to report our financial results accurately and timely. As a result, investors, counterparties and customers may lose confidence in the accuracy and completeness of our financial reports; our liquidity, access to capital markets and perceptions of our creditworthiness could be adversely affected; and the market price of our common stock could decline. In addition, we could become subject to investigations by the stock exchange on which our securities are listed, the SEC, the Federal Reserve, the FDIC, or other regulatory authorities, which could require additional financial and management resources. These events could have an adverse effect on our business, financial condition and results of operations.
We face significant operational risks due to the high volume and the high dollar value nature of transactions we process.
We operate in many different businesses in diverse markets and rely on the ability of our employees and systems to process transactions. Operational risk is the risk of loss resulting from our operations, including but not limited to, the risk of fraud by employees or persons outside the Company, the execution of unauthorized transactions, errors relating to transaction processing and technology, breaches of our internal control systems, compliance failures, business continuation and disaster recovery issues and other external events. Insurance coverage may not be available for such losses, or where available, such losses may exceed insurance limits. This risk of loss also includes the potential legal actions that could arise as a result of an operational deficiency or as a result of noncompliance with applicable regulatory standards, adverse business decisions or their implementation and customer attrition due to potential negative publicity. In the event of a breakdown in the internal control system, improper operation of systems or improper employee actions, we could suffer financial loss, face regulatory action and suffer damage to our reputation.
24
To the extent we engage in derivative transactions, we will be exposed to credit and market risk, which could adversely affect our profitability and financial condition.
While we do not currently engage in material derivative or hedging activity, we may in the future manage interest rate risk by, among other things, utilizing derivative instruments to minimize significant unplanned fluctuations in earnings that are caused by interest rate volatility. To the extent we engage in derivative transactions, we will be exposed to credit and market risk. If the counterparty fails to perform, credit risk exists to the extent of the fair value gain in the derivative. Market risk exists to the extent that interest rates change in ways that are significantly different from what we expect when we enter into the derivative transaction. The existence of credit and market risk associated with any derivative instruments we enter into could adversely affect our net interest income and, therefore, could have an adverse effect on our business, financial condition and results of operations.
System failure or cyber security breaches of our network security could subject us to increased operating costs as well as litigation and other potential losses.
Our computer systems and network infrastructure and those of third parties, on which we are highly dependent, are subject to security risks and could be susceptible to cyber attacks, such as denial of service attacks, hacking, terrorist activities or identity theft. Our business relies on the secure processing, transmission, storage and retrieval of confidential, proprietary and other information in its computer and data management systems and networks, and in the computer and data management systems and networks of third parties. In addition, to access our network, products and services, our customers and other third parties may use personal mobile devices or computing devices that are outside of our network environment and are subject to their own cybersecurity risks.
Cyber attacks could include computer viruses, malicious or destructive code, phishing attacks, denial of service or information, ransomware, improper access by employees or vendors, attacks on personal email of employees, ransom demands to not expose security vulnerabilities in our systems or the systems of third parties, or other security breaches, and could result in the destruction or exfiltration of data and systems. As cyber threats continue to evolve, we may be required to expend significant additional resources to continue to modify or enhance its protective measures or to investigate and remediate any information security vulnerabilities or incidents. Despite efforts to ensure the integrity of our systems and implement controls, processes, policies and other protective measures, we may not be able to anticipate all security breaches, nor may we be able to implement guaranteed preventive measures against such security breaches. Cyber threats are rapidly evolving and we may not be able to anticipate or prevent all such attacks and could be held liable for any security breach or loss.
Although we have programs in place related to business continuity, disaster recovery and information security to maintain the confidentiality, integrity, and availability of our systems, business applications and customer information, such disruptions may still give rise to interruptions in service to customers and loss or liability to us, including loss of customer data. Like other financial services firms, we and our third party providers continue to be the subject of cyber attacks. Although to this date we have not experienced any material losses or other material consequences related to cyber attacks to date, future cyber attacks could be more disruptive and damaging, and we may not be able to anticipate or prevent all such attacks. Further, cyber attacks may not be detected in a timely manner.
Cyber attacks or other information or security breaches, whether directed at us or third parties, may result in a material loss or have material consequences. Furthermore, the public perception that a cyber attack on our systems has been successful, whether or not this perception is correct, may damage our reputation with customers and third parties with whom it does business. Hacking of personal information and identity theft risks, in particular, could cause serious reputational harm. A successful penetration or circumvention of system security could cause us serious negative consequences, including loss of customers and business opportunities, costs associated with maintaining business relationships after an attack or breach; significant business disruption to our operations and business, misappropriation, exposure, or destruction of its confidential information, intellectual property, funds, and/or those of its customers; or damage to our, our customers’ and/or third parties’ computers or systems, and could result in a violation of applicable privacy laws and other laws, litigation exposure, regulatory fines, penalties or intervention, loss of confidence in our security measures, reputational damage, reimbursement or other compensatory costs, additional compliance costs, and could adversely impact our results of operations, liquidity and financial condition. In addition, we may not have adequate insurance coverage to compensate for losses from a cybersecurity event.
25
If our trademarks and trade names are not adequately protected, or if we are deemed to infringe the trademarks or trade names of others, then we may not be able to build name recognition in our markets of interest and our business may be adversely affected.
Our registered or unregistered trademarks or trade names may be challenged, infringed, or determined to be infringing on other marks. Competitors may have adopted or may adopt trade names or trademarks similar to ours, thereby impeding our ability to build brand identity and possibly leading to market confusion. In addition, there could be potential trade name or trademark infringement claims brought by owners of other registered trademarks or trademarks that incorporate variations of our registered or unregistered trademarks or trade names. Additionally, our efforts to enforce or protect our proprietary rights related to trademarks, trade secrets, domain names, copyrights or other intellectual property may be ineffective and could result in substantial costs and diversion of resources. Each of the foregoing could adversely impact our financial condition or results of operations.
We are subject to litigation, which could result in substantial judgment or settlement costs and legal expenses.
We are regularly involved in litigation matters in the ordinary course of business. We believe that these litigation matters should not have a material adverse effect on our business, financial condition, results of operations or future prospects. We cannot assure you, however, that we will be able to successfully defend or resolve any current or future litigation matters, in which case those litigation matters could have an adverse effect on our business, financial condition and results of operations.
We may invest in CLO securities or CLO warehouse financing structures, which may expose us to losses in connection with such investments.
We currently hold investments in certain CLO subordinated notes or preference shares or other CLO securities, and may continue to make such investments in the future. The subordinated notes or preference shares of a CLO are usually entitled to all of the income generated by the CLO after the CLO pays all of the interest due on the debt notes and its expenses. However, there will be little or no income available to the CLO subordinated notes or preference shares if there are defaults on the underlying collateral in excess of certain amounts or if the recoveries on such defaulted collateral are less than certain amounts. Similarly, any investment we make in debt securities of a CLO that are junior to other debt securities of the entity will be payable only in the event that the underlying collateral generates sufficient income to make the interest payments on the securities of the CLO that are senior to any such junior debt instruments. Consequently, the value of any investment we make in the subordinated notes, preference shares or other debt securities of CLOs could decrease substantially depending on the performance of the underlying collateral in such CLO. In addition, the subordinated notes, preference shares and other debt securities of CLOs are generally illiquid, and because they represent a leveraged investment in the CLO’s assets, their value will generally fluctuate more than the values of the underlying collateral. As of December 31, 2019, we had investments with a carrying amount of $8.4 million in the subordinated notes of three CLOs.
In addition, we have historically, and may in the future, invest in the subordinated notes or preference shares of CLO warehouse financing structures. Such investments will be entitled to all income generated by the underlying investments acquired during the warehouse period after the financing cost from warehouse credit facility is paid, but will bear the first loss incurred on such investments if they decrease in value and the CLO or other investment product is unable to be issued and the warehouse portfolio is liquidated. In such event, the subordinate note or preference share investors in such CLO warehouse would be exposed to losses up to the total amount of such investment if the CLO or other investment product does not close and the underlying investment pool is liquidated for a loss. Such a scenario may become more likely in times of economic distress or when the loans comprising the collateral pool of such warehouse, although still performing, may have declined in market value. Although we generally expect CLO warehouse arrangements to last approximately six to nine months before a CLO is issued, the CLO issuer may not be able to complete the issuance within the expected time frame or at all. We did not hold any CLO warehouse investments as of December 31, 2019.
Risks Relating to the Regulation of Our Industry
Our business, financial condition, results of operations and future prospects could be adversely affected by the highly regulated environment in which we operate.
As a financial holding company, we are subject to federal supervision and regulation. Federal regulation of the banking industry, along with tax and accounting laws, regulations, rules and standards, may limit our operations significantly and control the methods by which we conduct business, as they limit those of other banking organizations. Many of these regulations are intended to protect depositors, the public or the FDIC insurance funds, not stockholders. Regulatory requirements affect our lending practices, capital structure, investment practices, dividend policy and many other aspects of our business. There are laws and regulations which restrict transactions between us and our subsidiaries. These requirements may constrain our operations and the adoption of new laws and changes to or repeal of existing laws may have a further impact on our business, financial condition, results of operations and future prospects. Also, the burden imposed by those federal and state regulations may place banks in general and the Company in particular, at a competitive disadvantage compared to less regulated competitors.
26
We are also subject to requirements with respect to the confidentiality of information obtained from clients concerning their identity, business, personal financial information, employment and other matters. We require our personnel to agree to keep all such information confidential and we monitor compliance. Failure to comply with confidentiality requirements could result in material liability and adversely affect our business, financial condition, results of operations and future prospects.
Bank holding companies and financial institutions are extensively regulated and face an uncertain regulatory environment. Applicable laws, regulations, interpretations, enforcement policies and accounting principles have been subject to significant changes in recent years and may be subject to significant future changes. We cannot assure our stockholders that such future changes will not have an adverse effect on our business, financial condition and results of operations.
Federal and state regulatory agencies may adopt changes to their regulations or change the manner in which existing regulations are applied. We cannot predict the substance or effect of pending or future legislation or regulation or the application of laws and regulations to the Company. Compliance with current and potential regulation and scrutiny may significantly increase our costs, impede the efficiency of our internal business processes, require us to increase our regulatory capital and limit our ability to pursue business opportunities in an efficient manner by requiring us to expend significant time, effort and resources to ensure compliance. Additionally, evolving regulations and guidance concerning executive compensation may impose limitations on us that affect our ability to compete successfully for executive and management talent.
The CFPB was created under the Dodd-Frank Act to centralize responsibility for consumer financial protection with broad rulemaking authority to administer and carry out the purposes and objectives of the “Federal consumer financial laws and to prevent evasions thereof,” with respect to all financial institutions that offer financial products and services to consumers. The CFPB is also authorized to prescribe rules applicable to any covered person or service provider, identifying and prohibiting acts or practices that are “unfair, deceptive, or abusive” in connection with any transaction with a consumer for a consumer financial product or service, or the offering of a consumer financial product or service (“UDAAP authority”). The ongoing broad rulemaking powers of the CFPB and its UDAAP authority have the potential to have a significant impact on the operations of financial institutions offering consumer financial products or services. If the CFPB’s actions related to current and proposed regulations limit our ability to provide financial products or services, it may have an adverse effect on our business.
In addition, regulators may elect to alter the standards or the interpretation of the standards used to measure regulatory compliance or used to determine the adequacy of liquidity, certain risk management or other operational practices for bank or non-bank financial services companies. Such actions may impact our ability to implement our strategy and could affect us in substantial and unpredictable ways and could have an adverse effect on our business, financial condition and results of operations. Furthermore, the regulatory agencies have extremely broad discretion in their interpretation of the regulations and laws and their interpretation of the quality of our loan portfolio, securities portfolio and other assets. If any regulatory agency’s assessment of the quality of our assets differs from our assessment, we may be required to take additional charges that would have the effect of materially reducing our earnings, capital ratios and share price.
Legislative and regulatory actions taken now or in the future may increase our costs and impact our business, governance structure, financial condition or results of operations.
We are subject to extensive regulation by multiple regulatory bodies. These regulations may affect the manner and terms of delivery of our services. If we do not comply with governmental regulations, we may be subject to fines, penalties, lawsuits or material restrictions on our businesses in the jurisdiction where the violation occurred, which may adversely affect our business operations. Changes in these regulations can significantly affect the services that we provide as well as our costs of compliance with such regulations. In addition, adverse publicity and damage to our reputation arising from the failure or perceived failure to comply with legal, regulatory or contractual requirements could affect our ability to attract and retain customers.
Government regulatory agencies and political bodies continue to place increased focus and scrutiny on the bank or nonbank financial services industries.
New proposals for legislation may be introduced in the U.S. Congress that could further substantially increase regulation of the bank and non-bank financial services industries, impose restrictions on the operations and general ability of firms within the industry to conduct business consistent with historical practices, including in the areas of compensation, interest rates, financial product offerings and disclosures and have an effect on bankruptcy proceedings with respect to consumer residential real estate mortgages, among other things. Federal and state regulatory agencies also frequently adopt changes to their regulations or change the manner in which existing regulations are applied. Certain aspects of current or proposed regulatory or legislative changes to laws applicable to the financial industry, if enacted or adopted, may impact the profitability of our business activities, require more oversight or change certain of our business practices, including the ability to offer new products, obtain financing, attract deposits, make loans and achieve satisfactory interest spreads and could expose us to additional costs, including increased compliance costs. These changes also may require us to invest significant management attention and resources to make any necessary changes to operations to comply and could have an adverse effect on our business, financial condition and results of operations.
27
Federal and state regulators periodically examine our business and we may be required to remediate adverse examination findings.
The Federal Reserve, the FDIC, and the TDSML periodically examine our business, including our compliance with laws and regulations. If, as a result of an examination, a banking agency were to determine that our financial condition, capital resources, asset quality, earnings prospects, management, liquidity or other aspects of any of our operations had become unsatisfactory, or that we were in violation of any law or regulation, they may take a number of different remedial actions as they deem appropriate. These actions include the power to enjoin “unsafe or unsound” practices, to require affirmative action to correct any conditions resulting from any violation or practice, to issue an administrative order that can be judicially enforced, to direct an increase in our capital, to restrict our growth, to assess civil money penalties, to fine or remove officers and directors and, if it is concluded that such conditions cannot be corrected or there is an imminent risk of loss to depositors, to terminate our deposit insurance and place us into receivership or conservatorship. In addition, our asset management business is subject to inspection and examination by the SEC. Any regulatory action against us could have an adverse effect on our business, financial condition and results of operations.
Our FDIC deposit insurance premiums and assessments may increase.
The deposits of our bank subsidiary are insured by the FDIC up to legal limits and, accordingly, subject our bank subsidiary to the payment of FDIC deposit insurance assessments. The bank’s regular assessments are based on our bank subsidiary’s average consolidated total assets minus average tangible equity as well as by risk classification, which includes regulatory capital levels and the level of supervisory concern. In order to maintain a strong funding position and restore the reserve ratios of the DIF, the FDIC has, in the past, increased deposit insurance assessment rates and charged a special assessment to all FDIC-insured financial institutions. Further increases in assessment rates or special assessments may occur in the future, especially if there are significant financial institution failures. Any future special assessments, increases in assessment rates or required prepayments in FDIC insurance premiums could reduce our profitability or limit our ability to pursue certain business opportunities, which could have an adverse effect on our business, financial condition and results of operations.
The Federal Reserve may require us to commit capital resources to support our subsidiary bank.
As a matter of policy, the Federal Reserve expects a bank holding company to act as a source of financial and managerial strength to a subsidiary bank and to commit resources to support such subsidiary bank. The Dodd-Frank Act codified the Federal Reserve’s policy on serving as a source of financial strength. Under the “source of strength” doctrine, the Federal Reserve may require a bank holding company to make capital injections into a troubled subsidiary bank and may charge the bank holding company with engaging in unsafe and unsound practices for failure to commit resources to a subsidiary bank. A capital injection may be required at times when the holding company may not have the resources to provide it and therefore may be required to borrow the funds or raise capital. Any loans by a holding company to its subsidiary banks are subordinate in right of payment to deposits and to certain other indebtedness of such subsidiary bank. In the event of a bank holding company’s bankruptcy, the bankruptcy trustee will assume any commitment by the holding company to a federal bank regulatory agency to maintain the capital of a subsidiary bank. Moreover, bankruptcy law provides that claims based on any such commitment will be entitled to a priority of payment over the claims of the institution’s general unsecured creditors, including the holders of its note obligations. Thus, any borrowing that must be done by the bank holding company to make a required capital injection becomes more difficult and expensive and could have an adverse effect on our business, financial condition and results of operations.
28
Future acquisitions generally will require regulatory approvals.
Generally, any acquisition of target financial institutions, banking centers or other banking assets by us will require approval by and cooperation from, a number of governmental regulatory agencies, possibly including the Federal Reserve and the FDIC, as well as state banking regulators. In acting on applications, federal banking regulators consider, among other factors:
|
|
• |
the effect of the acquisition on competition; |
|
|
• |
the financial condition, liquidity, results of operations, capital levels and future prospects of the applicant and the bank(s) involved; |
|
|
• |
the quantity and complexity of previously consummated acquisitions; |
|
|
• |
the managerial resources of the applicant and the bank(s) involved; |
|
|
• |
the convenience and needs of the community, including the record of performance under the Community Reinvestment Act of 1977; |
|
|
• |
the effectiveness of the applicant in combating money-laundering activities; |
|
|
• |
the applicant’s regulatory compliance record; and |
|
|
• |
the extent to which the acquisition would result in greater or more concentrated risks to the stability of the United States banking or financial system. |
Such regulators could deny our application based on the above criteria or other considerations or the regulatory approvals may not be granted on terms that are acceptable to us. For example, we could be required to sell banking centers as a condition to receiving regulatory approvals and such a condition may not be acceptable to us or may reduce the benefit of any acquisition. In addition, we may be required to make certain capital commitments to our regulators in connection with any acquisition. The existence of such capital requirements, or the failure to meet any such requirements, may have a material adverse effect on our stockholders.
Future legislation or actions could harm our competitive position.
In addition to the enactment of the Dodd-Frank Act, various legislative bodies have considered or may consider legislation that could change banking statutes and the operating environment in substantial and unpredictable ways. If enacted, such legislation could increase or decrease the cost of doing business; limit or expand permissible activities; or affect the competitive balance among banks, savings associations, credit unions and other financial institutions. We cannot predict whether new legislation will be enacted and, if enacted, the effect that it or any regulations would have on our activities, financial condition or results of operations.
We are subject to commercial real estate lending guidance issued by the federal banking regulators that impacts our operations and capital requirements.
The federal banking regulators have issued final guidance regarding concentrations in commercial real estate lending directed at institutions that have particularly high concentrations of commercial real estate loans within their lending portfolios. This guidance suggests that institutions whose commercial real estate loans exceed certain percentages of capital should implement heightened risk management practices appropriate to their concentration risk and may be required to maintain higher capital ratios than institutions with lower concentrations in commercial real estate lending. Based on our commercial real estate concentration as of December 31, 2019, we believe that we are operating within the guidelines. However, increases in our commercial real estate lending could subject us to additional supervisory analysis. We cannot guarantee that any risk management practices we implement will be effective to prevent losses relating to our commercial real estate portfolio. Management has implemented controls to monitor our commercial real estate lending concentrations, but we cannot predict the extent to which this guidance will continue to impact our operations or capital requirements.
Regulatory initiatives regarding bank capital requirements may require heightened capital.
Regulatory capital rules, released in July 2013, implemented higher minimum capital requirements for bank holding companies and banks. The rules include a common equity Tier 1 capital requirement and establish criteria that instruments must meet to be considered common equity Tier 1 capital, additional Tier 1 capital or Tier 2 capital. These rules were intended to both improve the quality and increase the quantity of capital required to be held by banking organizations, better equipping the U.S. banking system to deal with adverse economic conditions. The capital rules require banks and bank holding companies to maintain a minimum common equity Tier 1 capital ratio of 4.5%, a total Tier 1 capital ratio of 6%, a total capital ratio of 8% and a leverage ratio of 4%. Bank holding companies are also required to hold a capital conservation buffer of common equity Tier 1 capital of 2.5% to avoid limitations on capital distributions and executive compensation payments. The capital rules also require banks and bank holding companies to maintain a common equity Tier 1 capital ratio of 6.5%, a total Tier 1 capital ratio of 8%, a total capital ratio of 10% and a leverage ratio of 5% to be deemed “well capitalized” for purposes of certain rules and prompt corrective action requirements.
29
The Federal Reserve may also set higher capital requirements for holding companies whose circumstances warrant it. For example, holding companies experiencing internal growth or making acquisitions are expected to maintain strong capital positions substantially above the minimum supervisory levels, without significant reliance on intangible assets. At this time, the bank regulatory agencies are more inclined to impose higher capital requirements to meet well-capitalized standards and future regulatory change could impose higher capital standards as a routine matter. The Company’s and its subsidiary’s regulatory capital ratios currently are in excess of the levels established for “well-capitalized” institutions.
These standards require the Company or our bank subsidiary to maintain materially more capital, with common equity as a more predominant component, or manage the configuration of our assets and liabilities to comply with formulaic liquidity requirements. Such regulation could significantly impact our return on equity, financial condition, operations, capital position and ability to pursue business opportunities which could have an adverse effect on our business, financial condition and results of operations.
We are subject to numerous laws designed to protect consumers, including the CRA and fair lending laws and failure to comply with these laws could lead to a wide variety of sanctions.
The CRA, the Equal Credit Opportunity Act, the Fair Housing Act and other fair lending laws and regulations impose nondiscriminatory lending requirements on financial institutions. The Department of Justice and other federal agencies, including the CFPB, are responsible for enforcing these laws and regulations. A successful regulatory challenge to an institution’s performance under the CRA or fair lending laws and regulations could result in a wide variety of sanctions, including damages and civil money penalties, injunctive relief, restrictions on mergers and acquisitions activity, restrictions on expansion and restrictions on entering new product lines. Private parties may also have the ability to challenge an institution’s performance under fair lending laws in private class action litigation. Such actions could have an adverse effect on our business, financial condition and results of operations.
Federal, state and local consumer lending laws may restrict our ability to originate certain mortgage loans or increase our risk of liability with respect to such loans and could increase our cost of doing business.
Federal, state and local laws have been adopted that are intended to eliminate certain lending practices considered “predatory.” These laws prohibit practices such as steering borrowers away from more affordable products, selling unnecessary insurance to borrowers, repeatedly refinancing loans and making loans without a reasonable expectation that the borrowers will be able to repay the loans irrespective of the value of the underlying property. It is our policy not to make predatory loans, but these laws create the potential for liability with respect to our lending and loan investment activities. They increase our cost of doing business and, ultimately, may prevent us from making certain loans and cause us to reduce the average percentage rate or the points and fees on loans that we do make.
We face a risk of noncompliance and enforcement action with the Bank Secrecy Act and other anti-money laundering statutes and regulations.
The Bank Secrecy Act, the Patriot Act and other laws and regulations require financial institutions, among other duties, to institute and maintain an effective anti-money laundering program and file suspicious activity and currency transaction reports as appropriate. The federal Financial Crimes Enforcement Network is authorized to impose significant civil money penalties for violations of those requirements and has recently engaged in coordinated enforcement efforts with the individual federal banking regulators, as well as the U.S. Department of Justice, Drug Enforcement Administration and IRS. We are also subject to increased scrutiny of compliance with the rules enforced by the Office of Foreign Assets Control. If our policies, procedures and systems are deemed deficient, we would be subject to liability, including fines and regulatory actions, which may include restrictions on our ability to pay dividends and the necessity to obtain regulatory approvals to proceed with certain aspects of our business plan, including any future acquisition plans. Failure to maintain and implement adequate programs to combat money laundering and terrorist financing could also have serious reputational consequences for us. Any of these results could have an adverse effect on our business, financial condition and results of operations.
There are substantial regulatory limitations on changes of control of a bank holding company.
With certain limited exceptions, federal regulations prohibit a person, a company or a group of persons deemed to be “acting in concert” from, directly or indirectly, acquiring more than 10% (5% if the acquirer is a bank holding company) of any class of our voting stock or obtaining the ability to control in any manner the election of a majority of our directors or otherwise direct the management or policies of the Company without prior notice or application to and the approval of the Federal Reserve. Companies investing in banks and bank holding companies receive additional review and may be required to become bank holding companies, subject to regulatory supervision. Accordingly, prospective investors must be aware of and comply with these requirements, if applicable, in connection with any purchase of shares of our common stock. These provisions effectively inhibit certain mergers or other business combinations, which, in turn, could adversely affect the market price of our common stock.
30
Risks Relating to the Company’s Common Stock
The market price of our common stock may be subject to substantial fluctuations, which may make it difficult for you to sell your shares at the volume, prices and times desired.
The market price of our common stock may be highly volatile, which may make it difficult for you to resell your shares at the volume, prices and times desired. There are many factors that may impact the market price and trading volume of our common stock, including, without limitation:
|
|
• |
actual or anticipated fluctuations in our operating results, financial condition or asset quality; |
|
|
• |
changes in economic or business conditions; |
|
|
• |
the effects of and changes in, trade, monetary and fiscal policies, including the interest rate policies of the Federal Reserve; |
|
|
• |
publication of research reports about us, our competitors or the bank and non-bank financial services industries generally, or changes in, or failure to meet, securities analysts’ estimates of our financial and operating performance, or lack of research reports by industry analysts or ceasing of coverage; |
|
|
• |
operating and stock price performance of companies that investors deem comparable to us; |
|
|
• |
future issuances of our common stock or other securities; |
|
|
• |
additions or departures of key personnel; |
|
|
• |
proposed or adopted changes in laws, regulations or policies affecting us; |
|
|
• |
perceptions in the marketplace regarding our competitors and/or us; |
|
|
• |
changes in accounting principles, policies and guidelines; |
|
|
• |
rapidly changing technology; |
|
|
• |
significant acquisitions or business combinations, strategic partnerships, joint ventures or capital commitments by or involving our competitors or us; |
|
|
• |
other economic, competitive, governmental, regulatory and technological factors affecting our operations, pricing, products and services; and |
|
|
• |
other news, announcements or disclosures (whether by us or others) related to us, our competitors, our core market or the bank and non-bank financial services industries. |
The stock market and, in particular, the market for financial institution stocks, have experienced substantial fluctuations in recent years, which in many cases have been unrelated to the operating performance and prospects of particular companies. In addition, significant fluctuations in the trading volume in our common stock may cause significant price variations to occur. Increased market volatility may materially and adversely affect the market price of our common stock, which could make it difficult to sell your shares at the volume, prices and times desired.
Securities analysts may not continue coverage on our common stock, which could adversely affect the market for our common stock.
The trading market for our common stock will depend in part on the research and reports that securities analysts publish about us and our business. We do not have any control over these securities analysts and they may not cover our common stock. If securities analysts do not cover our common stock, the lack of research coverage may adversely affect our market price. If we are covered by securities analysts and our common stock is the subject of an unfavorable report, the price of our common stock may decline. If one or more of these analysts cease to cover us or fail to publish regular reports on us, we could lose visibility in the financial markets, which could cause the price or trading volume of our common stock to decline.
31
The rights of our common stockholders are subordinate to the rights of any debt securities that we may issue and may be subordinate to the holders of any class of preferred stock that we may issue in the future.
Our board of directors has the authority to issue in the aggregate up to 1,000,000 shares of preferred stock and to determine the terms of each issue of preferred stock without stockholder approval. Accordingly, you should assume that any shares of preferred stock that we may issue in the future will also be senior to our common stock and could have a preference on liquidating distributions or a preference on dividends that could limit our ability to pay dividends to the holders of our common stock. Because our decision to issue debt or equity securities or incur other borrowings in the future will depend on market conditions and other factors beyond our control, the amount, timing, nature or success of our future capital-raising efforts is uncertain. Thus, common stockholders bear the risk that our future issuances of debt or equity securities or our incurrence of other borrowings will negatively affect the market price of our common stock.
We depend on the profitability of our bank subsidiary.
Our principal source of funds to pay dividends on our common and preferred stock and service any of our obligations are dividends received directly from our subsidiaries. A substantial percentage of our current operations are currently conducted through our bank subsidiary. As is the case with all financial institutions, the profitability of our bank subsidiary is subject to the fluctuating cost and availability of money and changes in interest rates and in economic conditions in general. In addition, various federal and state statutes limit the amount of dividends that our bank subsidiary may pay to us, with or without regulatory approval.
We do not intend to pay dividends in the foreseeable future and our future ability to pay dividends is subject to restrictions.
We have not historically declared or paid any cash dividends on our common stock since inception. Holders of our common stock are entitled to receive only such cash dividends as our board of directors may declare out of funds legally available for such payments. Any declaration and payment of dividends on common stock will depend upon our earnings and financial condition, liquidity and capital requirements, the general economic and regulatory climate, our ability to service any equity or debt obligations senior to the common stock and other factors deemed relevant by the board of directors. Furthermore, consistent with our business plans, growth initiatives, capital availability, projected liquidity needs and other factors, we have made and will continue to make, capital management decisions and policies that could adversely impact the amount of dividends, if any, paid to our common stockholders.
Our board of directors intends to retain all of our earnings to promote growth and build capital. Accordingly, we do not expect to pay dividends in the foreseeable future. In addition, we are subject to certain restrictions on the payment of cash dividends as a result of banking laws, regulations and policies. Further, the Federal Reserve issued Supervisory Letter SR 09-4 on February 24, 2009 and revised as of March 27, 2009, which provides guidance on the declaration and payment of dividends, capital redemptions and capital repurchases by bank holding companies. Supervisory Letter SR 09-4 provides that, as a general matter, a financial holding company should eliminate, defer or significantly reduce its dividends, if: (1) the financial holding company’s net income available to stockholders for the past four quarters, net of dividends previously paid during that period, is not sufficient to fully fund the dividends; (2) the financial holding company’s prospective rate of earnings retention is not consistent with the financial holding company’s capital needs and overall current and prospective financial condition; or (3) the financial holding company will not meet, or is in danger of not meeting, its minimum regulatory capital adequacy ratios. Failure to do so could result in a supervisory finding that the financial holding company is operating in an unsafe and unsound manner.
Our corporate governance documents and certain corporate and banking laws applicable to us, could make a takeover more difficult.
Certain provisions of our articles of incorporation and bylaws and corporate and federal banking laws and regulations could delay, defer or prevent a third party from acquiring control of our organization or conducting a proxy contest, even if those events were perceived by many of our stockholders as beneficial to their interests. These provisions, laws and regulations applicable to us:
|
|
• |
enable our board of directors to issue additional shares of authorized but unissued capital stock; |
|
|
• |
enable our board of directors to issue “blank check” preferred stock with such designations, rights and preferences as may be determined from time to time by our board of directors; |
|
|
• |
enable our board of directors to increase the size of our board of directors and fill the vacancies created by the increase; |
|
|
• |
do not provide for cumulative voting in the election of directors; |
|
|
• |
enable our board of directors to amend our bylaws without stockholder approval; |
|
|
• |
do not allow for the removal of directors without cause; |
|
|
• |
limit the right of stockholders to call a special meeting; |
|
|
• |
do not allow stockholder action by less than unanimous written consent; |
32
|
|
• |
require the affirmative vote of two-thirds of the outstanding shares of common stock to approve all amendments to our charter and approve mergers and similar transactions; |
|
|
• |
require advance notice for director nominations and other stockholder proposals; and |
|
|
• |
require prior regulatory application and approval of any transaction involving control of our organization. |
These provisions may discourage potential acquisition proposals and could delay or prevent a change in control, including under circumstances in which our stockholders might otherwise receive a premium over the market price of our shares.
ITEM 1B. UNRESOLVED STAFF COMMENTS.
None.
ITEM 2. PROPERTIES.
Our corporate office is located at 12700 Park Central Drive, Suite 1700, Dallas, Texas 75251.
As of December 31, 2019, TBK Bank operates ten branches in the Quad Cities Metropolitan Area of Iowa and Illinois and eight branches throughout northern and central Illinois in our Midwest division, seven branches in Colorado and three branches in New Mexico in our Mountain Division, thirty branches in Colorado and two branches in western Kansas in our Western division, and three loan production offices in Colorado and one loan production office in Missouri. TBK Bank also operates from our corporate office facility in Dallas, Texas which includes an additional branch office limited to deposit gathering activities. We lease twelve of these offices and own the remaining fifty-three. Our owned offices are freestanding permanent facilities and the leased offices are part of larger retail facilities. Most of TBK Bank’s branches are equipped with automated teller machines (“ATM”) and drive-through facilities.
Triumph Business Capital operates from a leased facility within a larger business park located in Coppell, Texas as well as a leased facility in El Paso, Texas.
ITEM 3. LEGAL PROCEEDINGS.
From time to time we are a party to various litigation matters incidental to the conduct of our business. We are not presently party to any legal proceedings the resolution of which we believe would have a material adverse effect on our business, prospects, financial condition, liquidity, results of operation, cash flows or capital levels.
ITEM 4. MINE SAFETY DISCLOSURES.
Not applicable.
33
PART II
ITEM 5. MARKET FOR REGISTRANT’S COMMON EQUITY, RELATED STOCKHOLDER MATTERS AND ISSUER PURCHASES OF EQUITY SECURITIES.
Market Information and Common Equity Holders
Our common stock is listed on the NASDAQ Global Select Market under the symbol “TBK.” At February 6, 2020, there were 24,605,453 shares outstanding and 366 stockholders of record for the Company’s common stock.
Dividends
We have not historically declared or paid cash dividends on our common stock since inception and we do not intend to pay dividends on our common stock for the foreseeable future. Instead, we anticipate that all of our future earnings will be retained to support our operations and to finance the growth and development of our business. Any future determination relating to our dividend policy will be made by our board of directors and will depend on a number of factors, including:
|
|
• |
our historic and projected financial condition, liquidity and results of operations; |
|
|
• |
our capital levels and needs; |
|
|
• |
tax considerations; |
|
|
• |
any acquisitions or potential acquisitions that we may examine; |
|
|
• |
statutory and regulatory prohibitions and other limitations; |
|
|
• |
the terms of any credit agreements or other borrowing arrangements that restrict our ability to pay cash dividends; |
|
|
• |
general economic conditions; and |
|
|
• |
other factors deemed relevant by our board of directors. |
We are not obligated to pay dividends on our common stock.
As a Texas corporation, we are subject to certain restrictions on dividends under the Texas Business Organizations Code (the “TBOC”). Generally, a Texas corporation may pay dividends to its stockholders out of its surplus (the excess of its assets over its liabilities and stated capital) or out of its net profits for the then-current and preceding fiscal year unless the corporation is insolvent or the dividend would render the corporation insolvent. In addition, we are subject to certain restrictions on the payment of cash dividends as a result of banking laws, regulations and policies.
Because we are a financial holding company and do not engage directly in business activities of a material nature, our ability to pay dividends to our stockholders depends, in large part, upon our receipt of dividends from our bank subsidiary, which is also subject to numerous limitations on the payment of dividends under federal and state banking laws, regulations and policies. The present and future dividend policy of our bank subsidiary is subject to the discretion of its board of directors. Our subsidiary bank is not obligated to pay dividends.
Securities authorized for issuance under equity compensation plans
See “Item 12 – Security Ownership of Certain Beneficial Owners and Management and Related Stockholder Matters”.
34
Performance Graph
The following Performance Graph and related discussion are being furnished solely to accompany this Annual Report on Form 10-K pursuant to Item 201(e) of Regulation S-K and shall not be deemed to be “soliciting materials” or to be “filed” with the SEC (other than as provided in Item 201) nor shall this information be incorporated by reference into any future filing under the Securities Act or the Exchange Act, whether made before or after the date hereof and irrespective of any general incorporation language contained therein, except to the extent that the Company specifically incorporates it by reference into a filing.
The following Performance Graph compares the cumulative total shareholder return on the Company’s common stock for the period beginning at the close of trading on December 31, 2014 through December 31, 2019, with the cumulative total return of the NASDAQ Global Select Market Index and the NASDAQ Bank Index for the same period. Cumulative total return is computed by dividing the difference between the Company’s share price at the end and the beginning of the measurement period by the share price at the beginning of the measurement period. The Performance Graph assumes an initial investment of $100 in the Company’s common stock, the NASDAQ Global Select Market Index and the NASDAQ Bank Index. Historical stock price performance is not necessarily indicative of future stock price performance.
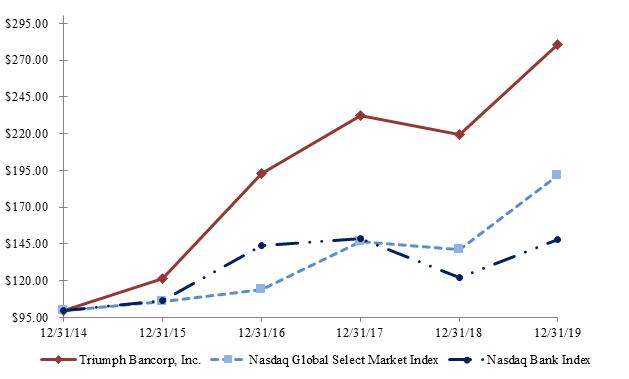
|
|
|
December 31, 2014 |
|
|
December 31, 2015 |
|
|
December 31, 2016 |
|
|
December 31, 2017 |
|
|
December 31, 2018 |
|
|
December 31, 2019 |
|
||||||
|
Triumph Bancorp, Inc. |
|
$ |
100.00 |
|
|
$ |
121.77 |
|
|
$ |
192.99 |
|
|
$ |
232.47 |
|
|
$ |
219.19 |
|
|
$ |
280.59 |
|
|
Nasdaq Global Select Market Index |
|
|
100.00 |
|
|
|
106.11 |
|
|
|
114.16 |
|
|
|
146.62 |
|
|
|
141.23 |
|
|
|
191.51 |
|
|
Nasdaq Bank Index |
|
|
100.00 |
|
|
|
106.63 |
|
|
|
143.97 |
|
|
|
149.02 |
|
|
|
122.35 |
|
|
|
148.32 |
|
Recent sales of unregistered equity securities
None.
35
Purchases of equity securities by the issuer and affiliated purchasers
On October 29, 2018, the Company announced that its board of directors had authorized the Company to repurchase up to $25,000,000 of the Company’s outstanding common stock. On July 17, 2019, the Company’s board of directors authorized the Company to repurchase up to an additional $25,000,000 of the Company’s outstanding common stock. During the nine months ended September 30, 2019, the Company repurchased 1,688,234 shares into treasury stock at an average price of $29.56 for a total of $49.9 million, effectively completing both of these stock repurchase programs.
On October 16, 2019 the Company’s board of directors authorized the Company to repurchase up to an additional $50.0 million of the Company’s outstanding common stock. The Company may repurchase these shares from time to time in open market transactions or through privately negotiated transactions at the Company’s discretion. The amount, timing and nature of any share repurchases will be based on a variety of factors, including the trading price of the Company’s common stock, applicable securities laws restrictions, regulatory limitations and market and economic factors. This repurchase program is authorized for a period of up to one year and does not require the Company to repurchase any specific number of shares. The repurchase program may be modified, suspended or discontinued at any time, at the Company’s discretion. The following repurchases were made under this program during the fourth quarter of 2019:
|
Period |
|
(a) Total number of shares (or units) purchased |
|
|
(b) Average price paid per share (or unit) |
|
|
(c) Total number of shares (or units) purchased as part of publicly announced plans or programs |
|
|
(d) Maximum number (or approximate dollar value) of shares (or units) that may yet be purchased under the plans or programs |
|
||||
|
October 1, 2019 - October 31, 2019 |
|
|
— |
|
|
$ |
— |
|
|
|
— |
|
|
$ |
50,000,000 |
|
|
November 1, 2019 - November 30, 2019 |
|
|
114,344 |
|
|
|
35.81 |
|
|
|
114,344 |
|
|
|
45,902,000 |
|
|
December 1, 2019 - December 31, 2019 |
|
|
278,213 |
|
|
|
37.05 |
|
|
|
278,213 |
|
|
|
35,586,000 |
|
|
Total |
|
|
392,557 |
|
|
$ |
36.69 |
|
|
|
392,557 |
|
|
|
35,586,000 |
|
During the period from January 1, 2020 through February 6, 2020, the Company has repurchased 366,482 shares into treasury stock under this program at an average price of $39.71.
36
ITEM 6. SELECTED FINANCIAL DATA.
Certain historical consolidated financial data as of and for each of the years in the five year period ended December 31, 2019 is derived from our audited historical consolidated financial statements. The following table shows our selected historical financial data for the periods indicated. You should read our selected historical financial data, together with the notes thereto, in conjunction with the more detailed information contained in our consolidated financial statements and related notes and “Management’s Discussion and Analysis of Financial Condition and Results of Operations” included in this Annual Report on Form 10-K.
|
|
|
As of and for the years ended December 31, |
|
|||||||||||||||||
|
(Dollars in thousands, except per share amounts) |
|
2019 |
|
|
2018 |
|
|
2017 |
|
|
2016 |
|
|
2015 |
|
|||||
|
Income Statement Data: |
|
|
|
|
|
|
|
|
|
|
|
|
|
|
|
|
|
|
|
|
|
Interest income |
|
$ |
311,153 |
|
|
$ |
262,976 |
|
|
$ |
177,224 |
|
|
$ |
124,492 |
|
|
$ |
98,760 |
|
|
Interest expense |
|
|
55,250 |
|
|
|
35,926 |
|
|
|
21,540 |
|
|
|
12,134 |
|
|
|
8,109 |
|
|
Net interest income |
|
|
255,903 |
|
|
|
227,050 |
|
|
|
155,684 |
|
|
|
112,358 |
|
|
|
90,651 |
|
|
Provision for loan losses |
|
|
7,942 |
|
|
|
16,167 |
|
|
|
11,628 |
|
|
|
6,693 |
|
|
|
4,529 |
|
|
Net interest income after provision |
|
|
247,961 |
|
|
|
210,883 |
|
|
|
144,056 |
|
|
|
105,665 |
|
|
|
86,122 |
|
|
Gain on sale of subsidiary or division |
|
|
— |
|
|
|
1,071 |
|
|
|
20,860 |
|
|
|
— |
|
|
|
— |
|
|
Bargain purchase gain |
|
|
— |
|
|
|
— |
|
|
|
— |
|
|
|
— |
|
|
|
15,117 |
|
|
Other noninterest income |
|
|
31,569 |
|
|
|
21,899 |
|
|
|
19,796 |
|
|
|
20,956 |
|
|
|
18,180 |
|
|
Noninterest income |
|
|
31,569 |
|
|
|
22,970 |
|
|
|
40,656 |
|
|
|
20,956 |
|
|
|
33,297 |
|
|
Noninterest expense |
|
|
204,084 |
|
|
|
167,353 |
|
|
|
123,614 |
|
|
|
93,112 |
|
|
|
81,865 |
|
|
Net income before income taxes |
|
|
75,446 |
|
|
|
66,500 |
|
|
|
61,098 |
|
|
|
33,509 |
|
|
|
37,554 |
|
|
Income tax expense |
|
|
16,902 |
|
|
|
14,792 |
|
|
|
24,878 |
|
|
|
12,809 |
|
|
|
8,421 |
|
|
Net income |
|
|
58,544 |
|
|
|
51,708 |
|
|
|
36,220 |
|
|
|
20,700 |
|
|
|
29,133 |
|
|
Dividends on preferred stock |
|
|
— |
|
|
|
(578 |
) |
|
|
(774 |
) |
|
|
(887 |
) |
|
|
(780 |
) |
|
Net income available to common stockholders |
|
$ |
58,544 |
|
|
$ |
51,130 |
|
|
$ |
35,446 |
|
|
$ |
19,813 |
|
|
$ |
28,353 |
|
|
|
|
|
|
|
|
|
|
|
|
|
|
|
|
|
|
|
|
|
|
|
|
Balance Sheet Data: |
|
|
|
|
|
|
|
|
|
|
|
|
|
|
|
|
|
|
|
|
|
Total assets |
|
$ |
5,060,297 |
|
|
$ |
4,559,779 |
|
|
$ |
3,499,033 |
|
|
$ |
2,641,067 |
|
|
$ |
1,691,313 |
|
|
Cash and cash equivalents |
|
|
197,880 |
|
|
|
234,939 |
|
|
|
134,129 |
|
|
|
114,514 |
|
|
|
105,277 |
|
|
Investment securities |
|
|
262,674 |
|
|
|
349,954 |
|
|
|
264,166 |
|
|
|
304,381 |
|
|
|
163,169 |
|
|
Loans held for sale |
|
|
2,735 |
|
|
|
2,106 |
|
|
|
— |
|
|
|
— |
|
|
|
1,341 |
|
|
Loans held for investment, net |
|
|
4,165,420 |
|
|
|
3,581,073 |
|
|
|
2,792,108 |
|
|
|
2,012,219 |
|
|
|
1,279,318 |
|
|
Total liabilities |
|
|
4,423,707 |
|
|
|
3,923,172 |
|
|
|
3,107,335 |
|
|
|
2,351,722 |
|
|
|
1,423,275 |
|
|
Noninterest bearing deposits |
|
|
809,696 |
|
|
|
724,527 |
|
|
|
564,225 |
|
|
|
363,351 |
|
|
|
168,264 |
|
|
Interest bearing deposits |
|
|
2,980,210 |
|
|
|
2,725,822 |
|
|
|
2,057,123 |
|
|
|
1,652,434 |
|
|
|
1,080,686 |
|
|
FHLB advances |
|
|
430,000 |
|
|
|
330,000 |
|
|
|
365,000 |
|
|
|
230,000 |
|
|
|
130,000 |
|
|
Subordinated notes |
|
|
87,327 |
|
|
|
48,929 |
|
|
|
48,828 |
|
|
|
48,734 |
|
|
|
— |
|
|
Junior subordinated debentures |
|
|
39,566 |
|
|
|
39,083 |
|
|
|
38,623 |
|
|
|
32,740 |
|
|
|
24,687 |
|
|
Total stockholders’ equity |
|
|
636,590 |
|
|
|
636,607 |
|
|
|
391,698 |
|
|
|
289,345 |
|
|
|
268,038 |
|
|
Preferred stockholders' equity |
|
|
— |
|
|
|
— |
|
|
|
9,658 |
|
|
|
9,746 |
|
|
|
9,746 |
|
|
Common stockholders' equity (1) |
|
|
636,590 |
|
|
|
636,607 |
|
|
|
382,040 |
|
|
|
279,599 |
|
|
|
258,292 |
|
37
|
|
|
As of and for the years ended December 31, |
|
|||||||||||||||||
|
|
|
2019 |
|
|
2018 |
|
|
2017 |
|
|
2016 |
|
|
2015 |
|
|||||
|
Per Share Data: |
|
|
|
|
|
|
|
|
|
|
|
|
|
|
|
|
|
|
|
|
|
Basic earnings per common share |
|
$ |
2.26 |
|
|
$ |
2.06 |
|
|
$ |
1.85 |
|
|
$ |
1.11 |
|
|
$ |
1.60 |
|
|
Diluted earnings per common share |
|
$ |
2.25 |
|
|
$ |
2.03 |
|
|
$ |
1.81 |
|
|
$ |
1.10 |
|
|
$ |
1.57 |
|
|
Book value per share |
|
$ |
25.50 |
|
|
$ |
23.62 |
|
|
$ |
18.35 |
|
|
$ |
15.47 |
|
|
$ |
14.34 |
|
|
Tangible book value per share (1) |
|
$ |
17.88 |
|
|
$ |
16.22 |
|
|
$ |
15.29 |
|
|
$ |
12.89 |
|
|
$ |
12.79 |
|
|
Shares outstanding end of period |
|
|
24,964,961 |
|
|
|
26,949,936 |
|
|
|
20,820,445 |
|
|
|
18,078,247 |
|
|
|
18,018,200 |
|
|
Weighted average shares outstanding - basic |
|
|
25,941,395 |
|
|
|
24,791,448 |
|
|
|
19,133,745 |
|
|
|
17,856,828 |
|
|
|
17,720,479 |
|
|
Weighted average shares outstanding - diluted |
|
|
26,060,005 |
|
|
|
25,480,513 |
|
|
|
20,000,288 |
|
|
|
18,053,531 |
|
|
|
18,524,889 |
|
|
|
|
|
|
|
|
|
|
|
|
|
|
|
|
|
|
|
|
|
|
|
|
Adjusted Per Share Data(1): |
|
|
|
|
|
|
|
|
|
|
|
|
|
|
|
|
|
|
|
|
|
Adjusted diluted earnings per common share |
|
$ |
2.25 |
|
|
$ |
2.21 |
|
|
$ |
1.37 |
|
|
$ |
1.17 |
|
|
$ |
0.80 |
|
|
Adjusted weighted average shares outstanding - diluted |
|
|
26,060,005 |
|
|
|
25,480,513 |
|
|
|
20,000,288 |
|
|
|
18,729,882 |
|
|
|
17,848,538 |
|
|
|
|
|
|
|
|
|
|
|
|
|
|
|
|
|
|
|
|
|
|
|
|
Performance ratios: |
|
|
|
|
|
|
|
|
|
|
|
|
|
|
|
|
|
|
|
|
|
Return on average assets |
|
|
1.23 |
% |
|
|
1.33 |
% |
|
|
1.27 |
% |
|
|
1.00 |
% |
|
|
1.89 |
% |
|
Return on average total equity |
|
|
9.04 |
% |
|
|
9.24 |
% |
|
|
10.66 |
% |
|
|
7.33 |
% |
|
|
11.31 |
% |
|
Return on average common equity |
|
|
9.04 |
% |
|
|
9.27 |
% |
|
|
10.73 |
% |
|
|
7.29 |
% |
|
|
11.44 |
% |
|
Return on average tangible common equity (1) |
|
|
12.93 |
% |
|
|
11.90 |
% |
|
|
12.50 |
% |
|
|
8.37 |
% |
|
|
12.98 |
% |
|
Yield on loans(2) |
|
|
7.75 |
% |
|
|
8.07 |
% |
|
|
7.55 |
% |
|
|
7.71 |
% |
|
|
8.62 |
% |
|
Cost of interest bearing deposits |
|
|
1.40 |
% |
|
|
1.02 |
% |
|
|
0.78 |
% |
|
|
0.70 |
% |
|
|
0.67 |
% |
|
Cost of total deposits |
|
|
1.12 |
% |
|
|
0.80 |
% |
|
|
0.62 |
% |
|
|
0.59 |
% |
|
|
0.58 |
% |
|
Cost of total funds |
|
|
1.36 |
% |
|
|
1.09 |
% |
|
|
0.86 |
% |
|
|
0.68 |
% |
|
|
0.64 |
% |
|
Net interest margin(2) |
|
|
5.92 |
% |
|
|
6.35 |
% |
|
|
5.92 |
% |
|
|
5.91 |
% |
|
|
6.49 |
% |
|
Efficiency ratio |
|
|
70.99 |
% |
|
|
66.94 |
% |
|
|
62.96 |
% |
|
|
69.84 |
% |
|
|
66.05 |
% |
|
Adjusted efficiency ratio (1) |
|
|
70.99 |
% |
|
|
64.43 |
% |
|
|
66.55 |
% |
|
|
68.63 |
% |
|
|
73.59 |
% |
|
Net noninterest expense to average assets |
|
|
3.61 |
% |
|
|
3.70 |
% |
|
|
2.92 |
% |
|
|
3.47 |
% |
|
|
3.16 |
% |
|
Adjusted net noninterest expense to average total assets (1) |
|
|
3.61 |
% |
|
|
3.55 |
% |
|
|
3.41 |
% |
|
|
3.39 |
% |
|
|
4.03 |
% |
|
|
|
|
|
|
|
|
|
|
|
|
|
|
|
|
|
|
|
|
|
|
|
Asset Quality ratios(3): |
|
|
|
|
|
|
|
|
|
|
|
|
|
|
|
|
|
|
|
|
|
Past due to total loans |
|
|
2.19 |
% |
|
|
2.41 |
% |
|
|
2.33 |
% |
|
|
3.61 |
% |
|
|
2.41 |
% |
|
Nonperforming loans to total loans |
|
|
0.97 |
% |
|
|
1.00 |
% |
|
|
1.38 |
% |
|
|
2.23 |
% |
|
|
1.03 |
% |
|
Nonperforming assets to total assets |
|
|
0.87 |
% |
|
|
0.84 |
% |
|
|
1.39 |
% |
|
|
1.98 |
% |
|
|
1.10 |
% |
|
ALLL to nonperforming loans |
|
|
71.63 |
% |
|
|
76.47 |
% |
|
|
48.41 |
% |
|
|
34.00 |
% |
|
|
94.10 |
% |
|
ALLL to total loans |
|
|
0.69 |
% |
|
|
0.76 |
% |
|
|
0.67 |
% |
|
|
0.76 |
% |
|
|
0.97 |
% |
|
Net charge-offs to average loans |
|
|
0.17 |
% |
|
|
0.23 |
% |
|
|
0.28 |
% |
|
|
0.25 |
% |
|
|
0.07 |
% |
|
|
|
|
|
|
|
|
|
|
|
|
|
|
|
|
|
|
|
|
|
|
|
Capital ratios: |
|
|
|
|
|
|
|
|
|
|
|
|
|
|
|
|
|
|
|
|
|
Tier 1 capital to average assets |
|
|
10.03 |
% |
|
|
11.08 |
% |
|
|
11.80 |
% |
|
|
10.85 |
% |
|
|
16.56 |
% |
|
Tier 1 capital to risk-weighted assets |
|
|
10.29 |
% |
|
|
11.49 |
% |
|
|
11.15 |
% |
|
|
11.85 |
% |
|
|
18.23 |
% |
|
Common equity Tier 1 capital to risk-weighted assets |
|
|
9.46 |
% |
|
|
10.55 |
% |
|
|
9.70 |
% |
|
|
10.18 |
% |
|
|
16.23 |
% |
|
Total capital to risk-weighted assets |
|
|
12.76 |
% |
|
|
13.35 |
% |
|
|
13.21 |
% |
|
|
14.60 |
% |
|
|
19.11 |
% |
|
Total stockholders' equity to total assets |
|
|
12.58 |
% |
|
|
13.96 |
% |
|
|
11.19 |
% |
|
|
10.96 |
% |
|
|
15.85 |
% |
|
Tangible common stockholders' equity ratio (1) |
|
|
9.16 |
% |
|
|
10.03 |
% |
|
|
9.26 |
% |
|
|
8.98 |
% |
|
|
13.85 |
% |
38
|
|
(1) |
The Company uses certain non-GAAP financial measures to provide meaningful supplemental information regarding the Company’s operational performance and to enhance investors’ overall understanding of such financial performance. The non-GAAP measures used by the Company include the following: |
|
|
• |
“Common stockholders’ equity” is defined as total stockholders’ equity at end of period less the liquidation preference value of the preferred stock. |
|
|
• |
“Adjusted diluted earnings per common share” is defined as adjusted net income available to common stockholders divided by adjusted weighted average diluted common shares outstanding. Excluded from net income available to common stockholders are material gains and expenses related to merger and acquisition-related activities, net of tax. In our judgment, the adjustments made to net income available to common stockholders allow management and investors to better assess our performance in relation to our core net income by removing the volatility associated with certain acquisition-related items and other discrete items that are unrelated to our core business. Weighted average diluted common shares outstanding are adjusted as a result of changes in their dilutive properties given the gain and expense adjustments described herein. |
|
|
• |
“Tangible common stockholders’ equity” is defined as common stockholders’ equity less goodwill and other intangible assets. |
|
|
• |
“Total tangible assets” is defined as total assets less goodwill and other intangible assets. |
|
|
• |
“Tangible book value per share” is defined as tangible common stockholders’ equity divided by total common shares outstanding. This measure is important to investors interested in changes from period-to-period in book value per share exclusive of changes in intangible assets. |
|
|
• |
“Tangible common stockholders’ equity ratio” is defined as the ratio of tangible common stockholders’ equity divided by total tangible assets. We believe that this measure is important to many investors in the marketplace who are interested in relative changes from period-to period in common equity and total assets, each exclusive of changes in intangible assets. |
|
|
• |
“Return on Average Tangible Common Equity” is defined as net income available to common stockholders divided by average tangible common stockholders’ equity. |
|
|
• |
“Adjusted efficiency ratio” is defined as noninterest expenses divided by our operating revenue, which is equal to net interest income plus noninterest income. Also excluded are material gains and expenses related to merger and acquisition-related activities, including divestitures. In our judgment, the adjustments made to operating revenue allow management and investors to better assess our performance in relation to our core operating revenue by removing the volatility associated with certain acquisition-related items and other discrete items that are unrelated to our core business. |
|
|
• |
“Adjusted net noninterest expense to average total assets” is defined as noninterest expenses net of noninterest income divided by total average assets. Excluded are material gains and expenses related to merger and acquisition-related activities, including divestitures. This metric is used by our management to better assess our operating efficiency. |
|
|
(2) |
Performance ratios include discount accretion on purchased loans for the periods presented as follows: |
|
|
|
|
For the years ended December 31, |
|
|||||||||||||||||
|
(Dollars in thousands) |
|
2019 |
|
|
2018 |
|
|
2017 |
|
|
2016 |
|
|
2015 |
|
|||||
|
Loan discount accretion |
|
$ |
5,568 |
|
|
$ |
8,296 |
|
|
$ |
7,071 |
|
|
$ |
7,363 |
|
|
$ |
4,651 |
|
(3) Asset quality ratios exclude loans held for sale.
39
GAAP Reconciliation of Non-GAAP Financial Measures
We believe the non-GAAP financial measures included above provide useful information to management and investors that is supplementary to our financial condition, results of operations and cash flows computed in accordance with GAAP; however, we acknowledge that our non-GAAP financial measures have a number of limitations. The following reconciliation table provides a more detailed analysis of the non-GAAP financial measures:
|
|
|
As of and for the years ended December 31, |
|
|||||||||||||||||
|
(Dollars in thousands, except per share amounts) |
|
2019 |
|
|
2018 |
|
|
2017 |
|
|
2016 |
|
|
2015 |
|
|||||
|
Total stockholders' equity |
|
$ |
636,590 |
|
|
$ |
636,607 |
|
|
$ |
391,698 |
|
|
$ |
289,345 |
|
|
$ |
268,038 |
|
|
Preferred stock liquidation preference |
|
|
— |
|
|
|
— |
|
|
|
(9,658 |
) |
|
|
(9,746 |
) |
|
|
(9,746 |
) |
|
Total common stockholders' equity |
|
|
636,590 |
|
|
|
636,607 |
|
|
|
382,040 |
|
|
|
279,599 |
|
|
|
258,292 |
|
|
Goodwill and other intangibles |
|
|
(190,286 |
) |
|
|
(199,417 |
) |
|
|
(63,778 |
) |
|
|
(46,531 |
) |
|
|
(27,854 |
) |
|
Tangible common stockholders' equity |
|
$ |
446,304 |
|
|
$ |
437,190 |
|
|
$ |
318,262 |
|
|
$ |
233,068 |
|
|
$ |
230,438 |
|
|
Common shares outstanding |
|
|
24,964,961 |
|
|
|
26,949,936 |
|
|
|
20,820,445 |
|
|
|
18,078,247 |
|
|
|
18,018,200 |
|
|
Tangible book value per share |
|
$ |
17.88 |
|
|
$ |
16.22 |
|
|
$ |
15.29 |
|
|
$ |
12.89 |
|
|
$ |
12.79 |
|
|
|
|
|
|
|
|
|
|
|
|
|
|
|
|
|
|
|
|
|
|
|
|
Total assets at end of period |
|
$ |
5,060,297 |
|
|
$ |
4,559,779 |
|
|
$ |
3,499,033 |
|
|
$ |
2,641,067 |
|
|
$ |
1,691,313 |
|
|
Goodwill and other intangibles |
|
|
(190,286 |
) |
|
|
(199,417 |
) |
|
|
(63,778 |
) |
|
|
(46,531 |
) |
|
|
(27,854 |
) |
|
Adjusted total assets at period end |
|
|
4,870,011 |
|
|
|
4,360,362 |
|
|
|
3,435,255 |
|
|
|
2,594,536 |
|
|
|
1,663,459 |
|
|
Tangible common stockholders' equity ratio |
|
|
9.16 |
% |
|
|
10.03 |
% |
|
|
9.26 |
% |
|
|
8.98 |
% |
|
|
13.85 |
% |
|
|
|
|
|
|
|
|
|
|
|
|
|
|
|
|
|
|
|
|
|
|
|
Net income available to common stockholders |
|
$ |
58,544 |
|
|
$ |
51,130 |
|
|
$ |
35,446 |
|
|
$ |
19,813 |
|
|
$ |
28,353 |
|
|
Gain on sale of subsidiary or division |
|
|
— |
|
|
|
(1,071 |
) |
|
|
(20,860 |
) |
|
|
— |
|
|
|
— |
|
|
Bargain purchase gain |
|
|
— |
|
|
|
— |
|
|
|
— |
|
|
|
— |
|
|
|
(15,117 |
) |
|
Transaction related costs |
|
|
— |
|
|
|
6,965 |
|
|
|
2,013 |
|
|
|
1,618 |
|
|
|
243 |
|
|
Incremental bonus related to transaction |
|
|
— |
|
|
|
— |
|
|
|
4,814 |
|
|
|
— |
|
|
|
1,750 |
|
|
Escrow recovery from DHF |
|
|
— |
|
|
|
— |
|
|
|
— |
|
|
|
— |
|
|
|
(300 |
) |
|
Tax effect of adjustments |
|
|
— |
|
|
|
(1,401 |
) |
|
|
5,153 |
|
|
|
(251 |
) |
|
|
(592 |
) |
|
Adjusted net income available to common stockholders |
|
$ |
58,544 |
|
|
$ |
55,623 |
|
|
$ |
26,566 |
|
|
$ |
21,180 |
|
|
$ |
14,337 |
|
|
Dilutive effect of convertible preferred stock |
|
|
— |
|
|
|
578 |
|
|
|
774 |
|
|
|
783 |
|
|
|
— |
|
|
Adjusted net income available to common stockholders - diluted |
|
$ |
58,544 |
|
|
$ |
56,201 |
|
|
$ |
27,340 |
|
|
$ |
21,963 |
|
|
$ |
14,337 |
|
|
|
|
|
|
|
|
|
|
|
|
|
|
|
|
|
|
|
|
|
|
|
|
Weighted average shares outstanding - diluted |
|
|
26,060,005 |
|
|
|
25,480,513 |
|
|
|
20,000,288 |
|
|
|
18,053,531 |
|
|
|
18,524,889 |
|
|
Adjusted effects of assumed Preferred Stock conversion |
|
|
— |
|
|
|
— |
|
|
|
— |
|
|
|
676,351 |
|
|
|
(676,351 |
) |
|
Adjusted weighted average shares outstanding - diluted |
|
|
26,060,005 |
|
|
|
25,480,513 |
|
|
|
20,000,288 |
|
|
|
18,729,882 |
|
|
|
17,848,538 |
|
|
Adjusted diluted earnings per common share |
|
$ |
2.25 |
|
|
$ |
2.21 |
|
|
$ |
1.37 |
|
|
$ |
1.17 |
|
|
$ |
0.80 |
|
|
|
|
|
|
|
|
|
|
|
|
|
|
|
|
|
|
|
|
|
|
|
|
Average total stockholders' equity |
|
$ |
647,726 |
|
|
$ |
559,450 |
|
|
$ |
339,911 |
|
|
$ |
282,416 |
|
|
$ |
257,550 |
|
|
Average preferred stock liquidation preference |
|
|
— |
|
|
|
(7,885 |
) |
|
|
(9,687 |
) |
|
|
(10,580 |
) |
|
|
(9,745 |
) |
|
Average total common stockholders' equity |
|
|
647,726 |
|
|
|
551,565 |
|
|
|
330,224 |
|
|
|
271,836 |
|
|
|
247,805 |
|
|
Average goodwill and other intangibles |
|
|
(194,905 |
) |
|
|
(121,820 |
) |
|
|
(46,663 |
) |
|
|
(35,176 |
) |
|
|
(29,413 |
) |
|
Average tangible common equity |
|
$ |
452,821 |
|
|
$ |
429,745 |
|
|
$ |
283,561 |
|
|
$ |
236,660 |
|
|
$ |
218,392 |
|
|
|
|
|
|
|
|
|
|
|
|
|
|
|
|
|
|
|
|
|
|
|
|
Net income available to common stockholders |
|
$ |
58,544 |
|
|
$ |
51,130 |
|
|
$ |
35,446 |
|
|
$ |
19,813 |
|
|
$ |
28,353 |
|
|
Average tangible common equity |
|
|
452,821 |
|
|
|
429,745 |
|
|
|
283,561 |
|
|
|
236,660 |
|
|
|
218,392 |
|
|
Return on average tangible common equity |
|
|
12.93 |
% |
|
|
11.90 |
% |
|
|
12.50 |
% |
|
|
8.37 |
% |
|
|
12.98 |
% |
40
|
|
|
Years Ended December 31, |
|
|||||||||||||||||
|
(Dollars in thousands, except per share amounts) |
|
2019 |
|
|
2018 |
|
|
2017 |
|
|
2016 |
|
|
2015 |
|
|||||
|
Adjusted efficiency ratio: |
|
|
|
|
|
|
|
|
|
|
|
|
|
|
|
|
|
|
|
|
|
Net interest income |
|
$ |
255,903 |
|
|
$ |
227,050 |
|
|
$ |
155,684 |
|
|
$ |
112,358 |
|
|
$ |
90,651 |
|
|
Noninterest income |
|
|
31,569 |
|
|
|
22,970 |
|
|
|
40,656 |
|
|
|
20,956 |
|
|
|
33,297 |
|
|
Operating revenue |
|
|
287,472 |
|
|
|
250,020 |
|
|
|
196,340 |
|
|
|
133,314 |
|
|
|
123,948 |
|
|
Gain on sale of subsidiary or division |
|
|
— |
|
|
|
(1,071 |
) |
|
|
(20,860 |
) |
|
|
— |
|
|
|
— |
|
|
Bargain purchase gain |
|
|
— |
|
|
|
— |
|
|
|
— |
|
|
|
— |
|
|
|
(15,117 |
) |
|
Escrow recovery from DHF |
|
|
— |
|
|
|
— |
|
|
|
— |
|
|
|
— |
|
|
|
(300 |
) |
|
Adjusted operating revenue |
|
$ |
287,472 |
|
|
$ |
248,949 |
|
|
$ |
175,480 |
|
|
$ |
133,314 |
|
|
$ |
108,531 |
|
|
|
|
|
|
|
|
|
|
|
|
|
|
|
|
|
|
|
|
|
|
|
|
Noninterest expenses |
|
$ |
204,084 |
|
|
$ |
167,353 |
|
|
$ |
123,614 |
|
|
$ |
93,112 |
|
|
$ |
81,865 |
|
|
Transaction related costs |
|
|
— |
|
|
|
(6,965 |
) |
|
|
(2,013 |
) |
|
|
(1,618 |
) |
|
|
(243 |
) |
|
Incremental bonus related to transaction |
|
|
— |
|
|
|
— |
|
|
|
(4,814 |
) |
|
|
— |
|
|
|
(1,750 |
) |
|
Adjusted noninterest expenses |
|
$ |
204,084 |
|
|
$ |
160,388 |
|
|
$ |
116,787 |
|
|
$ |
91,494 |
|
|
$ |
79,872 |
|
|
Adjusted efficiency ratio |
|
|
70.99 |
% |
|
|
64.43 |
% |
|
|
66.55 |
% |
|
|
68.63 |
% |
|
|
73.59 |
% |
|
|
|
|
|
|
|
|
|
|
|
|
|
|
|
|
|
|
|
|
|
|
|
Adjusted net noninterest expense to average assets ratio: |
|
|
|
|
|
|
|
|
|
|
|
|
|
|
|
|
|
|
|
|
|
Noninterest expenses |
|
$ |
204,084 |
|
|
$ |
167,353 |
|
|
$ |
123,614 |
|
|
$ |
93,112 |
|
|
$ |
81,865 |
|
|
Transaction related costs |
|
|
— |
|
|
|
(6,965 |
) |
|
|
(2,013 |
) |
|
|
(1,618 |
) |
|
|
(243 |
) |
|
Incremental bonus related to transaction |
|
|
— |
|
|
|
— |
|
|
|
(4,814 |
) |
|
|
— |
|
|
|
(1,750 |
) |
|
Adjusted noninterest expense |
|
|
204,084 |
|
|
|
160,388 |
|
|
|
116,787 |
|
|
|
91,494 |
|
|
|
79,872 |
|
|
Noninterest income |
|
|
31,569 |
|
|
|
22,970 |
|
|
|
40,656 |
|
|
|
20,956 |
|
|
|
33,297 |
|
|
Gain on sale of subsidiary or division |
|
|
— |
|
|
|
(1,071 |
) |
|
|
(20,860 |
) |
|
|
— |
|
|
|
— |
|
|
Bargain purchase gain |
|
|
— |
|
|
|
— |
|
|
|
— |
|
|
|
— |
|
|
|
(15,117 |
) |
|
Escrow recovery from DHF |
|
|
— |
|
|
|
— |
|
|
|
— |
|
|
|
— |
|
|
|
(300 |
) |
|
Adjusted noninterest income |
|
|
31,569 |
|
|
|
21,899 |
|
|
|
19,796 |
|
|
|
20,956 |
|
|
|
17,880 |
|
|
Adjusted net noninterest expenses |
|
$ |
172,515 |
|
|
$ |
138,489 |
|
|
$ |
96,991 |
|
|
$ |
70,538 |
|
|
$ |
61,992 |
|
|
Average total assets |
|
$ |
4,773,652 |
|
|
$ |
3,900,728 |
|
|
$ |
2,844,916 |
|
|
$ |
2,079,756 |
|
|
$ |
1,537,856 |
|
|
Adjusted net noninterest expense to average assets ratio |
|
|
3.61 |
% |
|
|
3.55 |
% |
|
|
3.41 |
% |
|
|
3.39 |
% |
|
|
4.03 |
% |
ITEM 7. MANAGEMENT’S DISCUSSION AND ANALYSIS OF FINANCIAL CONDITION AND RESULTS OF OPERATIONS.
Cautionary Note Regarding Forward-Looking Statements
This document contains forward-looking statements pursuant to the safe harbor provisions of the Private Securities Litigation Reform Act of 1995. These forward-looking statements reflect our current views with respect to, among other things, future events and our financial performance. These statements are often, but not always, made through the use of words or phrases such as “may,” “should,” “could,” “predict,” “potential,” “believe,” “will likely result,” “expect,” “continue,” “will,” “anticipate,” “seek,” “estimate,” “intend,” “plan,” “projection,” “would” and “outlook,” or the negative version of those words or other comparable of a future or forward-looking nature. These forward-looking statements are not historical facts and are based on current expectations, estimates and projections about our industry, management’s beliefs and certain assumptions made by management, many of which, by their nature, are inherently uncertain and beyond our control. Accordingly, we caution you that any such forward-looking statements are not guarantees of future performance and are subject to risks, assumptions and uncertainties that are difficult to predict. Although we believe that the expectations reflected in these forward-looking statements are reasonable as of the date made, actual results may prove to be materially different from the results expressed or implied by the forward-looking statements.
41
There are or will be important factors that could cause our actual results to differ materially from those indicated in these forward-looking statements, including, but not limited to, the following:
|
|
• |
business and economic conditions generally and in the bank and non-bank financial services industries, nationally and within our local market areas; |
|
|
• |
our ability to mitigate our risk exposures; |
|
|
• |
our ability to maintain our historical earnings trends; |
|
|
• |
changes in management personnel; |
|
|
• |
interest rate risk; |
|
|
• |
concentration of our products and services in the transportation industry; |
|
|
• |
credit risk associated with our loan portfolio; |
|
|
• |
lack of seasoning in our loan portfolio; |
|
|
• |
deteriorating asset quality and higher loan charge-offs; |
|
|
• |
time and effort necessary to resolve nonperforming assets; |
|
|
• |
inaccuracy of the assumptions and estimates we make in establishing reserves for probable loan losses and other estimates; |
|
|
• |
risks related to the integration of acquired businesses and any future acquisitions; |
|
|
• |
our ability to successfully identify and address the risks associated with our possible future acquisitions, and the risks that our prior and possible future acquisitions make it more difficult for investors to evaluate our business, financial condition and results of operations, and impairs our ability to accurately forecast our future performance; |
|
|
• |
lack of liquidity; |
|
|
• |
fluctuations in the fair value and liquidity of the securities we hold for sale; |
|
|
• |
impairment of investment securities, goodwill, other intangible assets or deferred tax assets; |
|
|
• |
our risk management strategies; |
|
|
• |
environmental liability associated with our lending activities; |
|
|
• |
increased competition in the bank and non-bank financial services industries, nationally, regionally or locally, which may adversely affect pricing and terms; |
|
|
• |
the accuracy of our financial statements and related disclosures; |
|
|
• |
material weaknesses in our internal control over financial reporting; |
|
|
• |
system failures or failures to prevent breaches of our network security; |
|
|
• |
the institution and outcome of litigation and other legal proceedings against us or to which we become subject; |
|
|
• |
changes in carry-forwards of net operating losses; |
|
|
• |
changes in federal tax law or policy; |
|
|
• |
the impact of recent and future legislative and regulatory changes, including changes in banking, securities and tax laws and regulations, such as the Dodd-Frank Act and their application by our regulators; |
|
|
• |
governmental monetary and fiscal policies; |
|
|
• |
changes in the scope and cost of FDIC, insurance and other coverages; |
|
|
• |
failure to receive regulatory approval for future acquisitions; and |
|
|
• |
increases in our capital requirements. |
42
The foregoing factors should not be construed as exhaustive. If one or more events related to these or other risks or uncertainties materialize, or if our underlying assumptions prove to be incorrect, actual results may differ materially from what we anticipate. Accordingly, you should not place undue reliance on any such forward-looking statements. Any forward-looking statement speaks only as of the date on which it is made and we do not undertake any obligation to publicly update or review any forward-looking statement, whether as a result of new information, future developments or otherwise. New factors emerge from time to time and it is not possible for us to predict which will arise. In addition, we cannot assess the impact of each factor on our business or the extent to which any factor, or combination of factors, may cause actual results to differ materially from those contained in any forward-looking statements.
Management’s Discussion and Analysis of Financial Condition and Results of Operations
This section presents management’s perspective on our financial condition and results of operations. The following discussion and analysis of our financial condition and results of operations should be read in conjunction with the Company’s consolidated financial statements and the accompanying notes included elsewhere in this Annual Report on Form 10-K. To the extent that this discussion describes prior performance, the descriptions relate only to the periods listed, which may not be indicative of our future financial outcomes. In addition to historical information, this discussion contains forward-looking statements that involve risks, uncertainties and assumptions that could cause results to differ materially from management’s expectations. See the “Cautionary Note Regarding Forward-Looking Statements” section above.
Overview
We are a financial holding company headquartered in Dallas, Texas and registered under the Bank Holding Company Act. Through our wholly owned bank subsidiary, TBK Bank, we offer traditional banking services, commercial finance product lines focused on businesses that require specialized financial solutions, and national lending product lines that further diversify our lending operations. Our traditional banking offerings include a full suite of lending and deposit products and services focused on our local market areas. These activities generate a stable source of core deposits and a diverse asset base to support our overall operations. Our commercial finance product lines generate attractive returns and include factoring, asset-based lending, and equipment lending products offered on a nationwide basis. Our national lending product lines provide further asset base diversification and include mortgage warehouse, liquid credit, and premium finance offered on a nationwide basis. As of December 31, 2019, we had consolidated total assets of $5.060 billion, gross loans held for investment of $4.195 billion, total deposits of $3.790 billion and total stockholders’ equity of $636.6 million.
A key element of our strategy is to supplement the asset generation capacity in our community banking markets with commercial finance product lines which are offered on a nationwide basis and which serve to enhance the overall yield of our portfolio. These products include our factoring services, provided principally in the transportation sector, our asset-based lending and equipment finance products. Our aggregate outstanding balances for these products increased $66.6 million, or 5.6% to $1.250 billion as of December 31, 2019, due to organic growth. The following table sets forth our commercial finance product lines:
|
(Dollars in thousands) |
|
December 31, 2019 |
|
|
December 31, 2018 |
|
||
|
Commercial finance |
|
|
|
|
|
|
|
|
|
Commercial - Equipment |
|
$ |
461,555 |
|
|
$ |
352,037 |
|
|
Commercial - Asset-based lending |
|
|
168,955 |
|
|
|
214,110 |
|
|
Factored receivables |
|
|
619,986 |
|
|
|
617,791 |
|
|
Total commercial finance loans |
|
$ |
1,250,496 |
|
|
$ |
1,183,938 |
|
Our national lending product lines include mortgage warehouse, liquid credit, and premium finance. Mortgage warehouse lending provides portfolio diversification by allowing unaffiliated mortgage originators to close one-to-four family real estate loans in their own name and manage cash flow needs until the loans are sold to investors. Our liquid credit portfolio, which consists of broadly syndicated shared national credits, provides an accordion feature allowing us to opportunistically scale our loan portfolio. Premium finance provides a lending product that complements our commercial finance products. The following table sets forth our national lending lines:
|
(Dollars in thousands) |
|
December 31, 2019 |
|
|
December 31, 2018 |
|
||
|
National lending |
|
|
|
|
|
|
|
|
|
Mortgage warehouse |
|
$ |
667,988 |
|
|
$ |
313,664 |
|
|
Commercial - Liquid credit |
|
|
81,353 |
|
|
|
963 |
|
|
Commercial - Premium finance |
|
|
101,015 |
|
|
|
72,302 |
|
|
Total national lending loans |
|
$ |
850,356 |
|
|
$ |
386,929 |
|
43
Most of our products and services share basic processes and have similar economic characteristics. However, our factoring subsidiary, Triumph Business Capital, operates in a highly specialized niche and earns substantially higher yields on its factored accounts receivable portfolio than our other lending products. This business also has a legacy and structure as a standalone company. We have determined our reportable segments are Banking, Factoring, and Corporate. For the year ended December 31, 2019, our banking segment generated 69% of our total revenue (comprised of interest and noninterest income), our factoring segment generated 30% of our total revenue, and our corporate segment generated 1% of our total revenue. On March 31, 2017, we sold our 100% membership interest in Triumph Capital Advisors, LLC (“TCA”) and discontinued fee based asset management services. TCA operations for the year ended December 31, 2017 are reflected in our Corporate segment, along with the gain on sale of our membership interest in TCA.
2019 Overview
Net income available to common stockholders for the year ended December 31, 2019 was $58.5 million, or $2.25 per diluted share, compared to net income available to common stockholders for the year ended December 31, 2018 of $51.1 million, or $2.03 per diluted share. Excluding material gains and expenses related to merger and acquisition related activities, including divestitures, adjusted net income to common stockholders was $55.6 million, or $2.21 per diluted share, for the year ended December 31, 2018. There were no merger and acquisition related activities during the year ended December 31, 2019. For the year ended December 31, 2019, our return on average common equity was 9.04% and our return on average assets was 1.23%.
At December 31, 2019, we had total assets of $5.060 billion, including gross loans held for investment of $4.195 billion, compared to $4.560 billion of total assets and $3.609 billion of gross loans held for investment at December 31, 2018. Organic loan growth totaled $585.9 million during the year ended December 31, 2019. Our commercial finance loans increased from $1.184 billion in aggregate as of December 31, 2018 to $1.250 billion as of December 31, 2019, an increase of 5.6%, and constitute 30% of our total loan portfolio at December 31, 2019. Our national lending lines increased from $386.9 million in aggregate as of December 31, 2018 to $850.4 million as of December 31, 2019, an increase of 119.8%, and constitute 20% of our total loan portfolio at December 31, 2019. Our community bank lending lines increased from $2.038 billion in aggregate as of December 31, 2018 to $2.094 billion as of December 31, 2019, an increase of 2.7%, and constitute 50% of our total loan portfolio at December 31, 2019.
At December 31, 2019, we had total liabilities of $4.424 billion, including total deposits of $3.790 billion, compared to $3.923 billion of total liabilities and $3.450 billion of total deposits at December 31, 2018. Deposits increased $339.6 million during the year ended December 31, 2019.
At December 31, 2019 and 2018, we had total stockholders' equity of $636.6 million. The increase in total equity from our net income for the year ended December 31, 2019 was offset by common stock repurchased during the period. Capital ratios remained strong with holding company Tier 1 capital and total capital to risk weighted assets ratios of 10.29% and 12.76%, respectively, at December 31, 2019.
For the year ended December 31, 2019, TriumphPay processed 874,790 invoices paying 66,218 distinct carriers a total of $975.1 million.
2019 Items of Note
Warehouse Solutions Inc. Investment
On October 17, 2019, we made a minority equity investment of $8 million in Warehouse Solutions Inc. (“WSI”), purchasing 8% of the common stock of WSI and receiving warrants to purchase an additional 10% of the common stock of WSI upon exercise of the warrants at a later date. WSI provides technology solutions to help reduce supply chain costs for a global client base across multiple industries.
44
Stock Repurchase Program
On October 29, 2018, we announced that our board of directors had authorized us to repurchase up to $25.0 million of our outstanding common stock. On July 17, 2019, our board of directors authorized the repurchase of up to an additional $25.0 million of our outstanding common stock. On October 16, 2019 our board of directors authorized us to repurchase up to an additional $50.0 million of our outstanding common stock. We may repurchase these shares from time to time in open market transactions or through privately negotiated transactions at our discretion. The amount, timing and nature of any share repurchases will be based on a variety of factors, including the trading price of our common stock, applicable securities laws restrictions, regulatory limitations and market and economic factors. This repurchase program is authorized for a period of up to one year and does not require us to repurchase any specific number of shares. The repurchase program may be modified, suspended or discontinued at any time, at our discretion.
No repurchases were made under these programs during the year ended December 31, 2018; however, during the year ended December 31, 2019, we repurchased into treasury stock 2,080,791 shares at an average price of $30.90 for a total of $64.4 million.
2018 Items of Note
First Bancorp of Durango, Inc. and Southern Colorado Corp.
Effective September 8, 2018, we acquired First Bancorp of Durango, Inc. (“FBD”) and its two community banking subsidiaries, The First National Bank of Durango and Bank of New Mexico, which were merged into TBK Bank upon closing, in an all-cash transaction for $134.7 million. On the same date, we acquired Southern Colorado Corp. (“SCC”) and its community banking subsidiary, Citizens Bank of Pagosa Springs, which was merged into TBK Bank upon closing, in an all-cash transaction for $13.3 million. As part of the FBD and SCC acquisitions, we acquired a combined $287.8 million of loans held for investment, assumed a combined $674.7 million of deposits, and recorded a combined $14.1 million of core deposit intangible assets and $72.1 million of goodwill.
Interstate Capital Corporation
On June 2, 2018 we acquired substantially all of the operating assets of, and assumed certain liabilities associated with, Interstate Capital Corporation’s (“ICC”) accounts receivable factoring business and other related financial services for total consideration of $180.3 million, which was comprised of $160.3 million in cash and contingent consideration with an initial fair value of $20.0 million. As part of the ICC acquisition, we acquired $131.0 million of factored receivables and recorded $13.9 million of intangible assets and $43.0 million of goodwill.
Common Stock Offering
On April 12, 2018, we completed an underwritten common stock offering issuing 5.4 million shares of our common stock, including 0.7 million shares sold pursuant to the underwriters' full exercise of their option to purchase additional shares, at $37.50 per share for total gross proceeds of $202.7 million. Net proceeds after underwriting discounts and offering expenses were $192.1 million. A significant portion of the net proceeds of this offering were used to fund the FBD, SCC and ICC acquisitions and for general corporate purposes.
Triumph Healthcare Finance
On January 19, 2018, we entered into an agreement to sell the assets of Triumph Healthcare Finance (“THF”) and exit the healthcare asset-based lending line of business. The sale was finalized on March 16, 2018 and resulted in a net pre-tax contribution to earnings for the three months ended March 31, 2018 of $1.1 million, or approximately $0.8 million net of tax.
For further information on the above transactions, see Note 2 – Business Combinations and Divestitures in the accompanying notes to the consolidated financial statements included elsewhere in this report.
Results of Operations
For discussion of the results of operations for the year ended December 31, 2018 compared with the year ended December 31, 2017, see Triumph’s 2018 Annual Report on Form 10-K, filed with the Securities and Exchange Commission on February 12, 2019.
Fiscal year ended December 31, 2019 compared with year ended December 31, 2018
Net Income
We earned net income of $58.5 million for the year ended December 31, 2019 compared to $51.7 million for the year ended December 31, 2018, an increase of $6.8 million.
45
The results for the year ended December 31, 2018 include the results of operations of the acquisitions of FBD, SCC, and ICC since their respective acquisition dates and are inclusive of a combined $7.0 million of transaction costs associated with the acquisitions included in noninterest expense. The results for the year ended December 31, 2018 were also impacted by the sale of THF, which resulted in a pre-tax gain on sale in the amount of $1.1 million included in noninterest income.
Excluding the tax-effected impact of the FBD, SCC and ICC transaction costs and the THF sale transaction, we earned adjusted net income of $56.2 million for the year ended December 31, 2018 compared to $58.5 million for the year ended December 31, 2019, an increase of $2.3 million. The adjusted increase was primarily the result of a $28.9 million increase in net interest income, an $8.2 million decrease in the provision for loan losses, and a $9.7 million increase in adjusted noninterest income. The adjusted increase was partially offset by a $43.8 million increase in adjusted noninterest expense and a $0.7 million increase in adjusted income tax expense.
Details of the changes in the various components of net income are further discussed below.
Net Interest Income
Our operating results depend primarily on our net interest income, which is the difference between interest income on interest earning assets, including loans and securities, and interest expense incurred on interest bearing liabilities, including deposits and other borrowed funds. Interest rate fluctuations, as well as changes in the amount and type of interest earning assets and interest bearing liabilities, combine to affect net interest income. Our net interest income is affected by changes in the amount and mix of interest earning assets and interest bearing liabilities, referred to as a “volume change.” It is also affected by changes in yields earned on interest earning assets and rates paid on interest bearing deposits and other borrowed funds, referred to as a “rate change.”
The following table presents the distribution of average assets, liabilities and equity, as well as interest income and fees earned on average interest earning assets and interest expense paid on average interest bearing liabilities:
|
|
|
For the years ended December 31, |
|
|||||||||||||||||||||||||||||||||
|
|
|
2019 |
|
|
2018 |
|
|
2017 |
|
|||||||||||||||||||||||||||
|
|
|
Average |
|
|
|
|
|
|
Average |
|
|
Average |
|
|
|
|
|
|
Average |
|
|
Average |
|
|
|
|
|
|
Average |
|
||||||
|
(Dollars in thousands) |
|
Balance |
|
|
Interest |
|
|
Rate |
|
|
Balance |
|
|
Interest |
|
|
Rate |
|
|
Balance |
|
|
Interest |
|
|
Rate |
|
|||||||||
|
Interest earning assets: |
|
|
|
|
|
|
|
|
|
|
|
|
|
|
|
|
|
|
|
|
|
|
|
|
|
|
|
|
|
|
|
|
|
|
|
|
|
Cash and cash equivalents |
|
$ |
137,615 |
|
|
$ |
3,062 |
|
|
|
2.23 |
% |
|
$ |
164,639 |
|
|
$ |
3,289 |
|
|
|
2.00 |
% |
|
$ |
124,802 |
|
|
$ |
1,450 |
|
|
|
1.16 |
% |
|
Taxable securities |
|
|
273,966 |
|
|
|
9,137 |
|
|
|
3.34 |
% |
|
|
191,644 |
|
|
|
4,962 |
|
|
|
2.59 |
% |
|
|
229,181 |
|
|
|
6,408 |
|
|
|
2.80 |
% |
|
Tax-exempt securities |
|
|
59,018 |
|
|
|
1,337 |
|
|
|
2.27 |
% |
|
|
71,120 |
|
|
|
1,392 |
|
|
|
1.96 |
% |
|
|
28,984 |
|
|
|
415 |
|
|
|
1.43 |
% |
|
FHLB and other restricted stock |
|
|
21,269 |
|
|
|
712 |
|
|
|
3.35 |
% |
|
|
18,013 |
|
|
|
507 |
|
|
|
2.81 |
% |
|
|
12,674 |
|
|
|
207 |
|
|
|
1.63 |
% |
|
Loans (1) |
|
|
3,832,239 |
|
|
|
296,905 |
|
|
|
7.75 |
% |
|
|
3,131,324 |
|
|
|
252,826 |
|
|
|
8.07 |
% |
|
|
2,235,481 |
|
|
|
168,744 |
|
|
|
7.55 |
% |
|
Total interest earning assets |
|
|
4,324,107 |
|
|
|
311,153 |
|
|
|
7.20 |
% |
|
|
3,576,740 |
|
|
|
262,976 |
|
|
|
7.35 |
% |
|
|
2,631,122 |
|
|
|
177,224 |
|
|
|
6.74 |
% |
|
Noninterest earning assets: |
|
|
|
|
|
|
|
|
|
|
|
|
|
|
|
|
|
|
|
|
|
|
|
|
|
|
|
|
|
|
|
|
|
|
|
|
|
Cash and cash equivalents |
|
|
80,206 |
|
|
|
|
|
|
|
|
|
|
|
66,325 |
|
|
|
|
|
|
|
|
|
|
|
39,497 |
|
|
|
|
|
|
|
|
|
|
Other noninterest earning assets |
|
|
369,339 |
|
|
|
|
|
|
|
|
|
|
|
257,663 |
|
|
|
|
|
|
|
|
|
|
|
174,297 |
|
|
|
|
|
|
|
|
|
|
Total assets |
|
$ |
4,773,652 |
|
|
|
|
|
|
|
|
|
|
$ |
3,900,728 |
|
|
|
|
|
|
|
|
|
|
$ |
2,844,916 |
|
|
|
|
|
|
|
|
|
|
Interest bearing liabilities: |
|
|
|
|
|
|
|
|
|
|
|
|
|
|
|
|
|
|
|
|
|
|
|
|
|
|
|
|
|
|
|
|
|
|
|
|
|
Deposits: |
|
|
|
|
|
|
|
|
|
|
|
|
|
|
|
|
|
|
|
|
|
|
|
|
|
|
|
|
|
|
|
|
|
|
|
|
|
Interest bearing demand |
|
|
593,178 |
|
|
|
1,492 |
|
|
|
0.25 |
% |
|
|
451,327 |
|
|
|
1,020 |
|
|
|
0.23 |
% |
|
|
331,023 |
|
|
|
526 |
|
|
|
0.16 |
% |
|
Individual retirement accounts |
|
|
110,553 |
|
|
|
1,731 |
|
|
|
1.57 |
% |
|
|
108,170 |
|
|
|
1,348 |
|
|
|
1.25 |
% |
|
|
100,731 |
|
|
|
1,221 |
|
|
|
1.21 |
% |
|
Money market |
|
|
433,922 |
|
|
|
5,752 |
|
|
|
1.33 |
% |
|
|
318,927 |
|
|
|
2,618 |
|
|
|
0.82 |
% |
|
|
209,229 |
|
|
|
509 |
|
|
|
0.24 |
% |
|
Savings |
|
|
363,760 |
|
|
|
478 |
|
|
|
0.13 |
% |
|
|
281,995 |
|
|
|
279 |
|
|
|
0.10 |
% |
|
|
175,821 |
|
|
|
105 |
|
|
|
0.06 |
% |
|
Certificates of deposit |
|
|
1,016,797 |
|
|
|
22,614 |
|
|
|
2.22 |
% |
|
|
809,321 |
|
|
|
11,994 |
|
|
|
1.48 |
% |
|
|
782,384 |
|
|
|
9,328 |
|
|
|
1.19 |
% |
|
Brokered deposits |
|
|
348,523 |
|
|
|
8,158 |
|
|
|
2.34 |
% |
|
|
291,776 |
|
|
|
5,799 |
|
|
|
1.99 |
% |
|
|
87,395 |
|
|
|
1,393 |
|
|
|
1.59 |
% |
|
Total interest bearing deposits |
|
|
2,866,733 |
|
|
|
40,225 |
|
|
|
1.40 |
% |
|
|
2,261,516 |
|
|
|
23,058 |
|
|
|
1.02 |
% |
|
|
1,686,583 |
|
|
|
13,082 |
|
|
|
0.78 |
% |
|
Subordinated notes |
|
|
52,682 |
|
|
|
3,553 |
|
|
|
6.74 |
% |
|
|
48,877 |
|
|
|
3,351 |
|
|
|
6.86 |
% |
|
|
48,779 |
|
|
|
3,344 |
|
|
|
6.86 |
% |
|
Junior subordinated debentures |
|
|
39,306 |
|
|
|
2,910 |
|
|
|
7.40 |
% |
|
|
38,845 |
|
|
|
2,741 |
|
|
|
7.06 |
% |
|
|
33,293 |
|
|
|
1,955 |
|
|
|
5.87 |
% |
|
Other borrowings |
|
|
377,375 |
|
|
|
8,562 |
|
|
|
2.27 |
% |
|
|
354,036 |
|
|
|
6,776 |
|
|
|
1.91 |
% |
|
|
313,357 |
|
|
|
3,159 |
|
|
|
1.01 |
% |
|
Total interest bearing liabilities |
|
|
3,336,096 |
|
|
|
55,250 |
|
|
|
1.66 |
% |
|
|
2,703,274 |
|
|
|
35,926 |
|
|
|
1.33 |
% |
|
|
2,082,012 |
|
|
|
21,540 |
|
|
|
1.03 |
% |
|
Noninterest bearing liabilities and equity: |
|
|
|
|
|
|
|
|
|
|
|
|
|
|
|
|
|
|
|
|
|
|
|
|
|
|
|
|
|
|
|
|
|
|
|
|
|
Noninterest bearing demand deposits |
|
|
723,682 |
|
|
|
|
|
|
|
|
|
|
|
605,863 |
|
|
|
|
|
|
|
|
|
|
|
408,729 |
|
|
|
|
|
|
|
|
|
|
Other liabilities |
|
|
66,148 |
|
|
|
|
|
|
|
|
|
|
|
32,141 |
|
|
|
|
|
|
|
|
|
|
|
14,264 |
|
|
|
|
|
|
|
|
|
|
Total equity |
|
|
647,726 |
|
|
|
|
|
|
|
|
|
|
|
559,450 |
|
|
|
|
|
|
|
|
|
|
|
339,911 |
|
|
|
|
|
|
|
|
|
|
Total liabilities and equity |
|
$ |
4,773,652 |
|
|
|
|
|
|
|
|
|
|
$ |
3,900,728 |
|
|
|
|
|
|
|
|
|
|
$ |
2,844,916 |
|
|
|
|
|
|
|
|
|
|
Net interest income |
|
|
|
|
|
$ |
255,903 |
|
|
|
|
|
|
|
|
|
|
$ |
227,050 |
|
|
|
|
|
|
|
|
|
|
$ |
155,684 |
|
|
|
|
|
|
Interest spread (2) |
|
|
|
|
|
|
|
|
|
|
5.54 |
% |
|
|
|
|
|
|
|
|
|
|
6.02 |
% |
|
|
|
|
|
|
|
|
|
|
5.71 |
% |
|
Net interest margin (3) |
|
|
|
|
|
|
|
|
|
|
5.92 |
% |
|
|
|
|
|
|
|
|
|
|
6.35 |
% |
|
|
|
|
|
|
|
|
|
|
5.92 |
% |
|
1. |
Balance totals include respective nonaccrual assets. |
|
2. |
Net interest spread is the yield on average interest earning assets less the rate on interest bearing liabilities. |
|
3. |
Net interest margin is the ratio of net interest income to average interest earning assets. |
46
The following table presents loan yields earned on our community banking and commercial finance loan portfolios:
|
|
|
For the years ended December 31, |
|
|||||||||
|
(Dollars in thousands) |
|
2019 |
|
|
2018 |
|
|
2017 |
|
|||
|
Average community banking |
|
$ |
2,158,683 |
|
|
$ |
1,762,184 |
|
|
$ |
1,281,550 |
|
|
Average commercial finance |
|
|
1,190,651 |
|
|
|
1,065,657 |
|
|
|
759,839 |
|
|
Average national lending |
|
|
482,905 |
|
|
|
303,483 |
|
|
|
194,092 |
|
|
Average total loans |
|
$ |
3,832,239 |
|
|
$ |
3,131,324 |
|
|
$ |
2,235,481 |
|
|
Community banking yield |
|
|
5.87 |
% |
|
|
5.86 |
% |
|
|
5.81 |
% |
|
Commercial finance yield |
|
|
12.23 |
% |
|
|
12.49 |
% |
|
|
11.15 |
% |
|
National lending yield |
|
|
5.11 |
% |
|
|
5.41 |
% |
|
|
4.93 |
% |
|
Total loan yield |
|
|
7.75 |
% |
|
|
8.07 |
% |
|
|
7.55 |
% |
We earned net interest income of $255.9 million for the year ended December 31, 2019 compared to $227.1 million for the year ended December 31, 2018, an increase of $28.8 million, or 12.7%, primarily driven by the following factors.
Interest income increased $48.2 million, or 18.3%, as a result of an increase in total average interest earning assets of $747.4 million, or 20.9%, which was attributable to a full-year impact of the FBD and SCC acquisitions which contributed $287.8 million of loans and $270.7 million of securities. We also experienced increased average balances in our other community banking lending products, including commercial real estate and general commercial and industrial loans, due to organic growth period over period. The increase is also attributable to growth in our factored receivable operations as a result of a full-year impact of the ICC acquisition. The average balance of our higher yielding commercial finance loans increased $125.0 million, or 11.7%, from $1.066 billion for the year ended December 31, 2018 to $1.191 billion for the year ended December 31, 2019 as a result of the full-year ICC acquisition impact and organic growth in our Equipment Finance portfolio. Additionally, our average mortgage warehouse lending balance was $370.4 million for the year ended December 31, 2019 compared to $242.9 million for the year ended December 31, 2018. A component of interest income consists of discount accretion on acquired loan portfolios. We recognized discount accretion on purchased loans of $5.6 million and $8.3 million for the years ended December 31, 2019 and 2018, respectively.
Interest expense increased $19.3 million, or 53.8%, as a result of growth in average customer deposits and other borrowings as well as higher average rates. Average total interest bearing deposits increased $605.2 million, or 26.8%, primarily due to a full-year impact of $674.7 million of customer deposits assumed in the FBD and SCC acquisitions. Excluding the acquired customer deposits, we also experienced growth in our certificates of deposit and brokered deposits as these higher cost deposit products were used to fund our growth period over period. In addition, our use of other interest bearing borrowings, consisting primarily of FHLB advances, was also increased to fund growth in our mortgage warehouse product.
Net interest margin decreased to 5.92% for the year ended December 31, 2019 from 6.35% for the year ended December 31, 2018, a decrease of 43 basis points or 6.8%.
The decrease in our net interest margin primarily resulted from an increase in our average cost of interest bearing liabilities of 33 basis points. This increase was caused by an increased use of higher rate certificates of deposit and brokered deposits to fund our growth period over period, and higher rates on short term and floating rate FHLB advances as a result of higher interest rates in the macro economy. This increase was partially offset by a change in the mix of our interest bearing deposits resulting from the full-year impact of lower cost customer deposits assumed in the FBD and SCC acquisitions.
Our net interest margin was also impacted by a decrease in yields on our interest earning assets of 15 basis points to 7.20% for the year ended December 31, 2019. This decrease was driven by a change in the overall mix within our loan portfolio period over period which drove a 32 basis point reduction in our loan yield to 7.75% for the same period. Our higher yielding average commercial finance products as a percentage of the average total loan portfolio decreased throughout the year from 34.0% for the year ended December 31, 2018 to 31.1% for the year ended December 31, 2019 contributing to the overall decrease in yield on our interest earning assets. In addition, our transportation factoring balances, which generate a higher yield than our non-transportation factoring balances, decreased as a percentage of the overall factoring portfolio to 77% at December 31, 2019 compared to 79% at December 31, 2018 and were also impacted by macroeconomic conditions in the transportation industry discussed below as part of our discussion of our Factoring Segment. Average factored receivables as a percentage of the total commercial finance portfolio increased from 48.3% for the year ended December 31, 2018 to 49.0% for the year ended December 31, 2019 partially offsetting the decrease in loan yields.
47
Changes in net interest income due to changes in rates and volume. The following table shows the effects changes in average balances (volume) and average interest rates (rate) had on the interest earned in our interest earning assets and the interest incurred on our interest bearing liabilities for the periods indicated. For purposes of this table, changes attributable to both rate and volume which cannot be segregated have been allocated to volume.
|
|
|
Years ended December 31, |
|
|||||||||||||||||||||
|
|
|
2019 Compared to 2018 |
|
|
2018 Compared to 2017 |
|
||||||||||||||||||
|
|
|
Increase (Decrease) Due to: |
|
|
|
|
|
|
Increase (Decrease) Due to: |
|
|
|
|
|
||||||||||
|
(Dollars in thousands) |
|
Rate |
|
|
Volume |
|
|
Net Change |
|
|
Rate |
|
|
Volume |
|
|
Net Change |
|
||||||
|
Interest earning assets: |
|
|
|
|
|
|
|
|
|
|
|
|
|
|
|
|
|
|
|
|
|
|
|
|
|
Cash and cash equivalents |
|
$ |
374 |
|
|
$ |
(601 |
) |
|
$ |
(227 |
) |
|
$ |
1,043 |
|
|
$ |
796 |
|
|
$ |
1,839 |
|
|
Taxable securities |
|
|
1,429 |
|
|
|
2,746 |
|
|
|
4,175 |
|
|
|
(474 |
) |
|
|
(972 |
) |
|
|
(1,446 |
) |
|
Tax-exempt securities |
|
|
219 |
|
|
|
(274 |
) |
|
|
(55 |
) |
|
|
152 |
|
|
|
825 |
|
|
|
977 |
|
|
FHLB stock |
|
|
96 |
|
|
|
109 |
|
|
|
205 |
|
|
|
150 |
|
|
|
150 |
|
|
|
300 |
|
|
Loans |
|
|
(10,225 |
) |
|
|
54,304 |
|
|
|
44,079 |
|
|
|
11,751 |
|
|
|
72,331 |
|
|
|
84,082 |
|
|
Total interest income |
|
|
(8,107 |
) |
|
|
56,284 |
|
|
|
48,177 |
|
|
|
12,622 |
|
|
|
73,130 |
|
|
|
85,752 |
|
|
Interest bearing liabilities: |
|
|
|
|
|
|
|
|
|
|
|
|
|
|
|
|
|
|
|
|
|
|
|
|
|
Interest bearing demand |
|
|
115 |
|
|
|
357 |
|
|
|
472 |
|
|
|
222 |
|
|
|
272 |
|
|
|
494 |
|
|
Individual retirement accounts |
|
|
346 |
|
|
|
37 |
|
|
|
383 |
|
|
|
34 |
|
|
|
93 |
|
|
|
127 |
|
|
Money market |
|
|
1,610 |
|
|
|
1,524 |
|
|
|
3,134 |
|
|
|
1,209 |
|
|
|
900 |
|
|
|
2,109 |
|
|
Savings |
|
|
92 |
|
|
|
107 |
|
|
|
199 |
|
|
|
69 |
|
|
|
105 |
|
|
|
174 |
|
|
Certificates of deposit |
|
|
6,006 |
|
|
|
4,614 |
|
|
|
10,620 |
|
|
|
2,267 |
|
|
|
399 |
|
|
|
2,666 |
|
|
Brokered deposits |
|
|
1,031 |
|
|
|
1,328 |
|
|
|
2,359 |
|
|
|
344 |
|
|
|
4,062 |
|
|
|
4,406 |
|
|
Total interest bearing deposits |
|
|
9,200 |
|
|
|
7,967 |
|
|
|
17,167 |
|
|
|
4,145 |
|
|
|
5,831 |
|
|
|
9,976 |
|
|
Subordinated notes |
|
|
(55 |
) |
|
|
257 |
|
|
|
202 |
|
|
|
— |
|
|
|
7 |
|
|
|
7 |
|
|
Junior subordinated debentures |
|
|
135 |
|
|
|
34 |
|
|
|
169 |
|
|
|
394 |
|
|
|
392 |
|
|
|
786 |
|
|
Other borrowings |
|
|
1,256 |
|
|
|
530 |
|
|
|
1,786 |
|
|
|
2,838 |
|
|
|
779 |
|
|
|
3,617 |
|
|
Total interest expense |
|
|
10,536 |
|
|
|
8,788 |
|
|
|
19,324 |
|
|
|
7,377 |
|
|
|
7,009 |
|
|
|
14,386 |
|
|
Change in net interest income |
|
$ |
(18,643 |
) |
|
$ |
47,496 |
|
|
$ |
28,853 |
|
|
$ |
5,245 |
|
|
$ |
66,121 |
|
|
$ |
71,366 |
|
Provision for Loan Losses
The provision for loan losses is the amount of expense that, based on our judgment, is required to maintain the allowance for loan and lease losses (the “ALLL”) at an appropriate level to absorb estimated incurred losses in the loan portfolio at the balance sheet date. The determination of the amount of the allowance is complex and involves a high degree of judgment and subjectivity.
Our ALLL was $29.1 million as of December 31, 2019 versus $27.6 million as of December 31, 2018, representing an ALLL to total loans ratio of 0.69% and 0.76% respectively.
Our provision for loan losses was $7.9 million for the year ended December 31, 2019 compared to $16.2 million for the year ended December 31, 2018, a decrease of $8.3 million, or 51.2%.
The decreased provision for loan losses was the result of decreased net charge-offs, lower net new specific reserves, changes to the mix of our period end loan portfolio and more stable reserve rates during the year ended December 31, 2019. Net charge-offs decreased by $0.9 million to $6.4 million for the year ended December 31, 2019 from $7.3 million for the year ended December 31, 2018. Approximately $1.7 million and $0.9 million of the charge-offs for the years ended December 31, 2019 and December 31, 2018, respectively, had specific reserves previously recorded in a prior period. We recorded net new specific reserves of $2.2 million during the year ended December 31, 2019 compared to net new specific reserves of $2.8 million recorded during the year ended December 31, 2018.
Outstanding loans increased $585.9 million during the year ended December 31, 2019. Excluding the aforementioned impact of the FBD and SCC acquisitions, during the year ended December 31, 2018 outstanding loans increased $510.0 million from December 31, 2017. Historically, an increase in the ending balance of our loan portfolio has resulted in an increase to our ALLL and resulting provision for loan loss however, the change in the provision for loan losses was impacted by a change in the mix of our loan portfolio year over year. At December 31, 2019, a smaller percentage of our overall loan portfolio consisted of commercial finance loan products which tend to carry a higher ALLL as compared to our traditional community banking loan products and our mortgage warehouse lending product. This change in mix, as well as more stable reserve rates, resulted in lower provision for loan losses year over year.
48
Noninterest Income
The following table presents the major categories of noninterest income:
|
|
|
Year ended December 31, |
|
|
2019 Compared to 2018 |
|
|
2018 Compared to 2017 |
|
|||||||||||||||||||
|
(Dollars in thousands) |
|
2019 |
|
|
2018 |
|
|
2017 |
|
|
$ Change |
|
|
% Change |
|
|
$ Change |
|
|
% Change |
|
|||||||
|
Service charges on deposits |
|
$ |
7,132 |
|
|
$ |
5,469 |
|
|
$ |
4,181 |
|
|
$ |
1,663 |
|
|
|
30.4 |
% |
|
$ |
1,288 |
|
|
|
30.8 |
% |
|
Card income |
|
|
7,873 |
|
|
|
6,514 |
|
|
|
3,822 |
|
|
|
1,359 |
|
|
|
20.9 |
% |
|
|
2,692 |
|
|
|
70.4 |
% |
|
Net OREO gains (losses) and valuation adjustments |
|
|
351 |
|
|
|
(514 |
) |
|
|
(850 |
) |
|
|
865 |
|
|
|
168.3 |
% |
|
|
336 |
|
|
|
39.5 |
% |
|
Net gains (losses) on sale of securities |
|
|
61 |
|
|
|
(272 |
) |
|
|
35 |
|
|
|
333 |
|
|
|
122.4 |
% |
|
|
(307 |
) |
|
|
(877.1 |
%) |
|
Fee income |
|
|
6,441 |
|
|
|
5,150 |
|
|
|
2,503 |
|
|
|
1,291 |
|
|
|
25.1 |
% |
|
|
2,647 |
|
|
|
105.8 |
% |
|
Insurance commissions |
|
|
4,219 |
|
|
|
3,492 |
|
|
|
2,981 |
|
|
|
727 |
|
|
|
20.8 |
% |
|
|
511 |
|
|
|
17.1 |
% |
|
Gain on sale of subsidiary or division |
|
|
— |
|
|
|
1,071 |
|
|
|
20,860 |
|
|
|
(1,071 |
) |
|
|
(100.0 |
%) |
|
|
(19,789 |
) |
|
|
(94.9 |
%) |
|
Asset management fees |
|
|
— |
|
|
|
— |
|
|
|
1,717 |
|
|
|
— |
|
|
|
— |
|
|
|
(1,717 |
) |
|
|
(100.0 |
%) |
|
CLO warehouse investment income |
|
|
— |
|
|
|
— |
|
|
|
2,226 |
|
|
|
— |
|
|
|
— |
|
|
|
(2,226 |
) |
|
|
(100.0 |
%) |
|
Other |
|
|
5,492 |
|
|
|
2,060 |
|
|
|
3,181 |
|
|
|
3,432 |
|
|
|
166.6 |
% |
|
|
(1,121 |
) |
|
|
(35.2 |
%) |
|
Total noninterest income |
|
$ |
31,569 |
|
|
$ |
22,970 |
|
|
$ |
40,656 |
|
|
$ |
8,599 |
|
|
|
37.4 |
% |
|
$ |
(17,686 |
) |
|
|
(43.5 |
%) |
Noninterest income increased $8.6 million, or 37.4%. Noninterest income for the year ended December 31, 2018 was impacted by the realization of the $1.1 million gain associated with the sale of THF in the first quarter of 2018. Excluding the gain on sale of THF, we earned adjusted noninterest income of $21.9 million for the year ended December 31, 2018, resulting in an adjusted increase in noninterest income of $9.7 million, or 44.3%, period over period. The adjusted increase was primarily due to increased service charges on deposits, card income, and fee income. Changes in selected components of noninterest income for the year ended December 31, 2019 are discussed below.
|
|
• |
Service Charges on Deposits. Service charges on deposit accounts, including overdraft and non-sufficient fund fees, increased $1.7 million, or 30.4%, primarily due to additional service charges associated with a full year of the increase in customer deposits due to the FBD and SCC acquisitions as well as organic growth in deposits during the year. |
|
|
• |
Card Income. Debit and credit card income increased $1.4 million, or 20.9%, primarily due to additional customer debit and credit card activity associated with the increase in issued cards resulting from the FBD and SCC acquisitions as well as cards issued to existing customers. This increase was offset by a $0.4 million incentive payment from our debit card provider for the achievement of certain growth goals recognized during the year ended December 31, 2018. No such incentive payment was recorded during the year ended December 31, 2019. |
|
|
• |
Net OREO gains (losses) and valuation adjustments. Net OREO gains (losses) and valuation adjustments, which represents gains and losses on loans transferred to OREO, gains and losses on the sale of OREO, and valuation adjustments recorded due to the subsequent change in fair value less costs to sell of OREO, reflect increased gains of $0.9 million. OREO activity on individual repossessed assets during the years ended December 31, 2019 and 2018 was not significant. |
|
|
• |
Fee income. Fee income increased $1.3 million, or 25.1%, primarily due to increased check and wire fees resulting from the FBD and SCC acquisitions as well as a full year to date impact of the ICC acquisition. |
|
|
• |
Other. Other noninterest income, including income associated with bank-owned life insurance and other miscellaneous activities increased $3.4 million, or 166.6%. The increase was driven by a $2.3 million increase in gain on sale of loans year over year. During the year ended December 31, 2019, we sold two loans acquired in previous bank acquisitions. The sales contributed $1.4 million to the overall $2.3 million increase in gain on sale year over year. There were no other significant increases or decreases in the components of other noninterest income period over period. |
49
Noninterest Expense
The following table presents the major categories of noninterest expense:
|
|
|
Year ended December 31, |
|
|
2019 Compared to 2018 |
|
|
2018 Compared to 2017 |
|
|||||||||||||||||||
|
(Dollars in thousands) |
|
2019 |
|
|
2018 |
|
|
2017 |
|
|
$ Change |
|
|
% Change |
|
|
$ Change |
|
|
% Change |
|
|||||||
|
Salaries and employee benefits |
|
$ |
112,862 |
|
|
$ |
90,212 |
|
|
$ |
72,696 |
|
|
$ |
22,650 |
|
|
|
25.1 |
% |
|
$ |
17,516 |
|
|
|
24.1 |
% |
|
Occupancy, furniture and equipment |
|
|
18,196 |
|
|
|
14,023 |
|
|
|
9,833 |
|
|
|
4,173 |
|
|
|
29.8 |
% |
|
|
4,190 |
|
|
|
42.6 |
% |
|
FDIC insurance and other regulatory assessments |
|
|
298 |
|
|
|
1,129 |
|
|
|
1,201 |
|
|
|
(831 |
) |
|
|
(73.6 |
%) |
|
|
(72 |
) |
|
|
(6.0 |
%) |
|
Professional fees |
|
|
7,288 |
|
|
|
8,939 |
|
|
|
7,192 |
|
|
|
(1,651 |
) |
|
|
(18.5 |
%) |
|
|
1,747 |
|
|
|
24.3 |
% |
|
Amortization of intangible assets |
|
|
9,131 |
|
|
|
6,980 |
|
|
|
5,201 |
|
|
|
2,151 |
|
|
|
30.8 |
% |
|
|
1,779 |
|
|
|
34.2 |
% |
|
Advertising and promotion |
|
|
6,126 |
|
|
|
4,974 |
|
|
|
3,226 |
|
|
|
1,152 |
|
|
|
23.2 |
% |
|
|
1,748 |
|
|
|
54.2 |
% |
|
Communications and technology |
|
|
20,976 |
|
|
|
18,270 |
|
|
|
8,843 |
|
|
|
2,706 |
|
|
|
14.8 |
% |
|
|
9,427 |
|
|
|
106.6 |
% |
|
Travel and entertainment |
|
|
5,434 |
|
|
|
4,234 |
|
|
|
2,661 |
|
|
|
1,200 |
|
|
|
28.3 |
% |
|
|
1,573 |
|
|
|
59.1 |
% |
|
Other |
|
|
23,773 |
|
|
|
18,592 |
|
|
|
12,761 |
|
|
|
5,181 |
|
|
|
27.9 |
% |
|
|
5,831 |
|
|
|
45.7 |
% |
|
Total noninterest expense |
|
$ |
204,084 |
|
|
$ |
167,353 |
|
|
$ |
123,614 |
|
|
$ |
36,731 |
|
|
|
21.9 |
% |
|
$ |
43,739 |
|
|
|
35.4 |
% |
Noninterest expense increased $36.7 million, or 21.9%. Noninterest expense for the year ended December 31, 2018 was impacted by $1.1 million of transaction costs associated with the ICC acquisition and $5.9 million of transaction costs associated with the FBD and SCC transactions. Excluding transaction costs, we incurred adjusted noninterest expense of $160.4 million for the year ended December 31, 2018, resulting in an adjusted net increase in noninterest expense of $43.7 million, or 27.2% period over period. Details of the more significant changes in the various components of noninterest expense for the year ended December 31, 2019 are discussed below.
|
|
• |
Salaries and Employee Benefits. Salaries and employee benefits expenses increased $22.7 million, or 25.1%. We experienced a significant increase in the total size of our workforce as our average full-time equivalent employees were 1,118.8 and 959.5 for the years ended December 31, 2019 and 2018, respectively. Sources of this increased average headcount were primarily employees added through the aforementioned acquisitions. In addition, employees were hired to support growth in our operations. Other factors contributing to the increase in salaries and employee benefits include merit increases for existing employees, higher health insurance benefit costs, incentive compensation, and 401(k) expense. |
|
|
• |
Occupancy, Furniture and Equipment. Occupancy, furniture and equipment expenses increased $4.2 million, or 29.8%, primarily due to expenses associated with the infrastructure and facilities added through the aforementioned acquisitions and growth in our overall operations. |
|
|
• |
FDIC Insurance and Other Regulatory Assessments. FDIC insurance and other regulatory assessments decreased $0.8 million, or 73.6%, primarily due to the application of a small bank credit by the FDIC during the year ended December 31, 2019. |
|
|
• |
Professional Fees. Professional fees, which are primarily comprised of external audit, tax, consulting, and legal fees, decreased $1.7 million, or 18.5% primarily due to $1.1 million of professional fees incurred in connection with the ICC acquisition and $1.4 million of professional fees incurred in connection with the FBD and SCC acquisitions during the year ended December 31, 2018 that were not incurred during the year ended December 31, 2019. |
|
|
• |
Amortization of intangible assets. Amortization of intangible assets increased $2.2 million, or 30.8%, primarily due to the full 2019 period impact of the addition of intangible assets resulting from the aforementioned acquisitions. |
|
|
• |
Advertising and promotion. Advertising and promotion expenses increased $1.2 million, or 23.2%, primarily due to advertising and brand-awareness activities in our branch network as well as various internal initiatives associated with the overall growth of operations. |
|
|
• |
Communications and Technology. Communications and technology expenses increased $2.7 million, or 14.8%, primarily as a result of increased usage and transaction volumes resulting from the aforementioned acquisitions as well as growth in our organic operations. Partially offsetting this increase was $3.1 million in information technology deconversion and termination fees related to our acquisition of FBD and SCC that were recognized during the year ended December 31, 2018. No such fees were incurred during the year ended December 31, 2019. |
|
|
• |
Travel and entertainment. Travel and entertainment expenses increased $1.2 million, or 28.3%, primarily due to increased travel in the normal course of business as a result of our expanded operations. |
50
|
|
• |
Other. Other noninterest expense includes loan-related expenses, software amortization, training and recruiting, postage, insurance, and subscription services. Other noninterest expense increased $5.2 million, or 27.9%, debit and credit card expense increased $0.8 million and software amortization expense increased $0.9 million primarily due to increased operations resulting from the aforementioned acquisitions as well as organic growth in the business. There were no other significant increases or decreases in the components of other noninterest expense period over period. |
Income Taxes
The amount of income tax expense is influenced by the amount of pre-tax income, the amount of tax-exempt income, changes in the statutory rate and the effect of changes in valuation allowances maintained against deferred tax benefits.
Income tax expense increased $2.1 million, or 14.2%, from $14.8 million for the year ended December 31, 2018 to $16.9 million for the year ended December 31, 2019. The increase in income tax expense period over period is consistent with the increase in pre-tax income for the same periods. The effective tax rate was 22% for the years ended December 31, 2019 and 2018.
Operating Segment Results
Our reportable segments are Banking, Factoring, and Corporate, which have been determined based upon their business processes and economic characteristics. This determination also gave consideration to the structure and management of various product lines. The Banking segment includes the operations of TBK Bank. Our Banking segment derives its revenue principally from investments in interest earning assets as well as noninterest income typical for the banking industry. The Banking segment also includes certain factored receivables which are purchased by TBK Bank. The Factoring segment includes the operations of Triumph Business Capital with revenue derived from factoring services. Corporate includes holding company financing and investment activities, asset management fees associated with TCA prior to its sale on March 31, 2017, and management and administrative expenses to support the overall operations of the Company.
Reported segments and the financial information of the reported segments are not necessarily comparable with similar information reported by other financial institutions. Additionally, because of the interrelationships of the various segments, the information presented is not indicative of how the segments would perform if they operated as independent entities. Changes in management structure or allocation methodologies and procedures may result in future changes to previously reported segment financial data. The accounting policies of the segments are the same as those described in Note 1 – Summary of Significant Accounting Policies in the accompanying notes to the consolidated financial statements included elsewhere in this report. Transactions between segments consist primarily of borrowed funds. Beginning in 2019, intersegment interest expense is allocated to the Factoring segment based on Federal Home Loan Bank advance rates. Prior to 2019, intersegment interest was calculated based on the Company’s prime rate. The provision for loan loss is allocated based on the segment’s ALLL determination. Noninterest income and expense directly attributable to a segment are assigned accordingly. Taxes are paid on a consolidated basis and are not allocated for segment purposes.
The following tables present our primary operating results for our operating segments:
|
(Dollars in thousands) |
|
|
|
|
|
|
|
|
|
|
|
|
|
|
|
|
|
Year Ended December 31, 2019 |
|
Banking |
|
|
Factoring |
|
|
Corporate |
|
|
Consolidated |
|
||||
|
Total interest income |
|
$ |
211,742 |
|
|
$ |
98,247 |
|
|
$ |
1,164 |
|
|
$ |
311,153 |
|
|
Intersegment interest allocations |
|
|
11,294 |
|
|
|
(11,294 |
) |
|
|
— |
|
|
|
— |
|
|
Total interest expense |
|
|
48,786 |
|
|
|
— |
|
|
|
6,464 |
|
|
|
55,250 |
|
|
Net interest income (expense) |
|
|
174,250 |
|
|
|
86,953 |
|
|
|
(5,300 |
) |
|
|
255,903 |
|
|
Provision for loan losses |
|
|
5,533 |
|
|
|
2,486 |
|
|
|
(77 |
) |
|
|
7,942 |
|
|
Net interest income (expense) after provision |
|
|
168,717 |
|
|
|
84,467 |
|
|
|
(5,223 |
) |
|
|
247,961 |
|
|
Noninterest income |
|
|
26,875 |
|
|
|
4,727 |
|
|
|
(33 |
) |
|
|
31,569 |
|
|
Noninterest expense |
|
|
148,620 |
|
|
|
51,780 |
|
|
|
3,684 |
|
|
|
204,084 |
|
|
Operating income (loss) |
|
$ |
46,972 |
|
|
$ |
37,414 |
|
|
$ |
(8,940 |
) |
|
$ |
75,446 |
|
51
|
(Dollars in thousands) |
|
|
|
|
|
|
|
|
|
|
|
|
|
|
|
|
|
Year Ended December 31, 2018 |
|
Banking |
|
|
Factoring |
|
|
Corporate |
|
|
Consolidated |
|
||||
|
Total interest income |
|
$ |
170,871 |
|
|
$ |
90,092 |
|
|
$ |
2,013 |
|
|
$ |
262,976 |
|
|
Intersegment interest allocations |
|
|
20,191 |
|
|
|
(20,191 |
) |
|
|
— |
|
|
|
— |
|
|
Total interest expense |
|
|
29,834 |
|
|
|
— |
|
|
|
6,092 |
|
|
|
35,926 |
|
|
Net interest income (expense) |
|
|
161,228 |
|
|
|
69,901 |
|
|
|
(4,079 |
) |
|
|
227,050 |
|
|
Provision for loan losses |
|
|
12,373 |
|
|
|
3,802 |
|
|
|
(8 |
) |
|
|
16,167 |
|
|
Net interest income (expense) after provision |
|
|
148,855 |
|
|
|
66,099 |
|
|
|
(4,071 |
) |
|
|
210,883 |
|
|
Gain on sale of subsidiary or division |
|
|
1,071 |
|
|
|
— |
|
|
|
— |
|
|
|
1,071 |
|
|
Other noninterest income |
|
|
18,364 |
|
|
|
3,483 |
|
|
|
52 |
|
|
|
21,899 |
|
|
Noninterest expense |
|
|
119,283 |
|
|
|
43,495 |
|
|
|
4,575 |
|
|
|
167,353 |
|
|
Operating income (loss) |
|
$ |
49,007 |
|
|
$ |
26,087 |
|
|
$ |
(8,594 |
) |
|
$ |
66,500 |
|
|
(Dollars in thousands) |
|
|
|
|
|
|
|
|
|
|
|
|
|
|
|
|
|
Year Ended December 31, 2017 |
|
Banking |
|
|
Factoring |
|
|
Corporate |
|
|
Consolidated |
|
||||
|
Total interest income |
|
$ |
130,480 |
|
|
$ |
45,346 |
|
|
$ |
1,398 |
|
|
$ |
177,224 |
|
|
Intersegment interest allocations |
|
|
8,023 |
|
|
|
(8,023 |
) |
|
|
— |
|
|
|
— |
|
|
Total interest expense |
|
|
16,240 |
|
|
|
— |
|
|
|
5,300 |
|
|
|
21,540 |
|
|
Net interest income (expense) |
|
|
122,263 |
|
|
|
37,323 |
|
|
|
(3,902 |
) |
|
|
155,684 |
|
|
Provision for loan losses |
|
|
9,310 |
|
|
|
2,227 |
|
|
|
91 |
|
|
|
11,628 |
|
|
Net interest income (expense) after provision |
|
|
112,953 |
|
|
|
35,096 |
|
|
|
(3,993 |
) |
|
|
144,056 |
|
|
Gain on sale of subsidiary or division |
|
|
— |
|
|
|
— |
|
|
|
20,860 |
|
|
|
20,860 |
|
|
Other noninterest income |
|
|
14,336 |
|
|
|
2,737 |
|
|
|
2,723 |
|
|
|
19,796 |
|
|
Noninterest expense |
|
|
90,632 |
|
|
|
22,641 |
|
|
|
10,341 |
|
|
|
123,614 |
|
|
Operating income (loss) |
|
$ |
36,657 |
|
|
$ |
15,192 |
|
|
$ |
9,249 |
|
|
$ |
61,098 |
|
|
(Dollars in thousands) |
|
|
|
|
|
|
|
|
|
|
|
|
|
|
|
|
|
|
|
|
|
December 31, 2019 |
|
Banking |
|
|
Factoring |
|
|
Corporate |
|
|
Eliminations |
|
|
Consolidated |
|
|||||
|
Total assets |
|
$ |
4,976,009 |
|
|
$ |
662,002 |
|
|
$ |
771,048 |
|
|
$ |
(1,348,762 |
) |
|
$ |
5,060,297 |
|
|
Gross loans held for investment |
|
$ |
4,108,735 |
|
|
$ |
573,372 |
|
|
$ |
1,519 |
|
|
$ |
(489,114 |
) |
|
$ |
4,194,512 |
|
|
|
|
|
|
|
|
|
|
|
|
|
|
|
|
|
|
|
|
|
|
|
|
(Dollars in thousands) |
|
|
|
|
|
|
|
|
|
|
|
|
|
|
|
|
|
|
|
|
|
December 31, 2018 |
|
Banking |
|
|
Factoring |
|
|
Corporate |
|
|
Eliminations |
|
|
Consolidated |
|
|||||
|
Total assets |
|
$ |
4,458,399 |
|
|
$ |
688,245 |
|
|
$ |
737,530 |
|
|
$ |
(1,324,395 |
) |
|
$ |
4,559,779 |
|
|
Gross loans held for investment |
|
$ |
3,523,850 |
|
|
$ |
588,750 |
|
|
$ |
10,795 |
|
|
$ |
(514,751 |
) |
|
$ |
3,608,644 |
|
Banking
|
(Dollars in thousands) |
|
Years Ended December 31, |
|
|
2019 Compared to 2018 |
|
|
2018 Compared to 2017 |
|
|||||||||||||||||||
|
Banking |
|
2019 |
|
|
2018 |
|
|
2017 |
|
|
$ Change |
|
|
% Change |
|
|
$ Change |
|
|
% Change |
|
|||||||
|
Total interest income |
|
$ |
211,742 |
|
|
$ |
170,871 |
|
|
$ |
130,480 |
|
|
$ |
40,871 |
|
|
|
23.9 |
% |
|
$ |
40,391 |
|
|
|
31.0 |
% |
|
Intersegment interest allocations |
|
|
11,294 |
|
|
|
20,191 |
|
|
|
8,023 |
|
|
|
(8,897 |
) |
|
|
(44.1 |
%) |
|
|
12,168 |
|
|
|
151.7 |
% |
|
Total interest expense |
|
|
48,786 |
|
|
|
29,834 |
|
|
|
16,240 |
|
|
|
18,952 |
|
|
|
63.5 |
% |
|
|
13,594 |
|
|
|
83.7 |
% |
|
Net interest income (expense) |
|
|
174,250 |
|
|
|
161,228 |
|
|
|
122,263 |
|
|
|
13,022 |
|
|
|
8.1 |
% |
|
|
38,965 |
|
|
|
31.9 |
% |
|
Provision for loan losses |
|
|
5,533 |
|
|
|
12,373 |
|
|
|
9,310 |
|
|
|
(6,840 |
) |
|
|
(55.3 |
%) |
|
|
3,063 |
|
|
|
32.9 |
% |
|
Net interest income (expense) after provision |
|
|
168,717 |
|
|
|
148,855 |
|
|
|
112,953 |
|
|
|
19,862 |
|
|
|
13.3 |
% |
|
|
35,902 |
|
|
|
31.8 |
% |
|
Gain on sale of subsidiary or division |
|
|
— |
|
|
|
1,071 |
|
|
|
— |
|
|
|
(1,071 |
) |
|
|
(100.0 |
%) |
|
|
1,071 |
|
|
|
100.0 |
% |
|
Other noninterest income |
|
|
26,875 |
|
|
|
18,364 |
|
|
|
14,336 |
|
|
|
8,511 |
|
|
|
46.3 |
% |
|
|
4,028 |
|
|
|
28.1 |
% |
|
Noninterest expense |
|
|
148,620 |
|
|
|
119,283 |
|
|
|
90,632 |
|
|
|
29,337 |
|
|
|
24.6 |
% |
|
|
28,651 |
|
|
|
31.6 |
% |
|
Operating income (loss) |
|
$ |
46,972 |
|
|
$ |
49,007 |
|
|
$ |
36,657 |
|
|
$ |
(2,035 |
) |
|
|
(4.2 |
%) |
|
$ |
12,350 |
|
|
|
33.7 |
% |
Our Banking segment’s operating income decreased $2.0 million, or 4.2%.
52
Interest income increased primarily as a result of increases in the balances of our interest earning assets, primarily loans, due to the continued growth of our general commercial loans and commercial real estate loans. In addition, we acquired a combined $287.8 million of loans and $270.7 million of investment securities in our Banking segment as part of the FBD and SCC acquisitions which closed during the last month of the third quarter of 2018. Average loans in our Banking segment increased 23.7% from $3.035 billion for the year ended December 31, 2018 to $3.753 billion for the year ended December 31, 2019.
Interest expense increased primarily as a result of higher rates and growth in average customer deposits and other borrowings due to $674.7 million of customer deposits assumed in the FBD and SCC acquisitions. Excluding the acquired customer deposits, we also experienced growth in our certificates of deposit and brokered deposits as these higher cost deposit products were used to fund our growth period over period. In addition, our use of other interest bearing borrowings, consisting primarily of FHLB advances, was also increased to fund our growth.
The decreased provision for loan losses at our Banking Segment was the result of decreased net charge-offs, lower net new specific reserves, and more stable reserve rates during the year ended December 31, 2019. Net charge-offs decreased by $1.7 million to $4.5 million for the year ended December 31, 2019 from $6.2 million for the year ended December 31, 2018. Approximately $1.7 million and $0.4 million of the charge-offs for the years ended December 31, 2019 and December 31, 2018 had specific reserves previously recorded in a prior period. We recorded net new specific reserves of $1.0 million during the year ended December 31, 2019 compared to net new specific reserves of $1.3 million recorded during the year ended December 31, 2018. Loans in our Banking segment grew at a faster organic pace for the year ended December 31, 2019 compared to the same period in 2018 however, this loan growth was primarily in mortgage warehouse lending and general commercial lending which carry a lower reserve rate than our commercial finance products. This change in mix, as well as more stable reserve rates, resulted in lower provision for loan losses year over year.
Noninterest income at our Banking segment increased primarily due to additional service charges, fee income and card income associated with the increase in customer deposit and credit/debit card accounts acquired in the FBD and SCC acquisitions. The increase in noninterest income year over year was partially offset by a $1.1 million pre-tax gain on the sale of THF during the first quarter of 2018.
Noninterest expense increased due to incremental costs associated with the growth in our Banking segment personnel and infrastructure in conjunction with our acquisitions of FBD and SCC, as well as personnel, facilities and infrastructure to support the continued organic growth in our lending operations. In addition, increases due to merit increases for existing employees, higher health insurance benefit costs, incentive compensation, and 401(k) expense contributed to the increase. The increase in noninterest expense year over year was partially offset by $4.6 million of transaction costs resulting from the FBD and SCC acquisitions.
Factoring
|
(Dollars in thousands) |
|
Years Ended December 31, |
|
|
2019 Compared to 2018 |
|
|
2018 Compared to 2017 |
|
|||||||||||||||||||
|
Factoring |
|
2019 |
|
|
2018 |
|
|
2017 |
|
|
$ Change |
|
|
% Change |
|
|
$ Change |
|
|
% Change |
|
|||||||
|
Total interest income |
|
$ |
98,247 |
|
|
$ |
90,092 |
|
|
$ |
45,346 |
|
|
$ |
8,155 |
|
|
|
9.1 |
% |
|
$ |
44,746 |
|
|
|
98.7 |
% |
|
Intersegment interest allocations |
|
|
(11,294 |
) |
|
|
(20,191 |
) |
|
|
(8,023 |
) |
|
|
8,897 |
|
|
|
44.1 |
% |
|
|
(12,168 |
) |
|
|
(151.7 |
%) |
|
Total interest expense |
|
|
— |
|
|
|
— |
|
|
|
— |
|
|
|
— |
|
|
|
— |
|
|
|
— |
|
|
|
— |
|
|
Net interest income (expense) |
|
|
86,953 |
|
|
|
69,901 |
|
|
|
37,323 |
|
|
|
17,052 |
|
|
|
24.4 |
% |
|
|
32,578 |
|
|
|
87.3 |
% |
|
Provision for loan losses |
|
|
2,486 |
|
|
|
3,802 |
|
|
|
2,227 |
|
|
|
(1,316 |
) |
|
|
(34.6 |
%) |
|
|
1,575 |
|
|
|
70.7 |
% |
|
Net interest income (expense) after provision |
|
|
84,467 |
|
|
|
66,099 |
|
|
|
35,096 |
|
|
|
18,368 |
|
|
|
27.8 |
% |
|
|
31,003 |
|
|
|
88.3 |
% |
|
Noninterest income |
|
|
4,727 |
|
|
|
3,483 |
|
|
|
2,737 |
|
|
|
1,244 |
|
|
|
35.7 |
% |
|
|
746 |
|
|
|
27.3 |
% |
|
Noninterest expense |
|
|
51,780 |
|
|
|
43,495 |
|
|
|
22,641 |
|
|
|
8,285 |
|
|
|
19.0 |
% |
|
|
20,854 |
|
|
|
92.1 |
% |
|
Operating income (loss) |
|
$ |
37,414 |
|
|
$ |
26,087 |
|
|
$ |
15,192 |
|
|
$ |
11,327 |
|
|
|
43.4 |
% |
|
$ |
10,895 |
|
|
|
71.7 |
% |
53
|
|
|
As of and for the Year Ended December 31, |
|
|||||||||
|
|
|
2019 |
|
|
2018 |
|
|
2017 |
|
|||
|
Factored receivable period end balance |
|
$ |
573,372,000 |
|
|
$ |
588,750,000 |
|
|
$ |
346,293,000 |
|
|
Yield on average receivable balance |
|
|
18.02 |
% |
|
|
18.43 |
% |
|
|
17.05 |
% |
|
Rolling twelve quarter annual charge-off rate |
|
|
0.39 |
% |
|
|
0.37 |
% |
|
|
0.41 |
% |
|
Factored receivables - transportation concentration |
|
|
81 |
% |
|
|
83 |
% |
|
|
84 |
% |
|
|
|
|
|
|
|
|
|
|
|
|
|
|
|
Interest income, including fees |
|
$ |
98,247,000 |
|
|
$ |
90,092,000 |
|
|
$ |
45,346,000 |
|
|
Noninterest income |
|
|
4,727,000 |
|
|
|
3,483,000 |
|
|
|
2,737,000 |
|
|
Factored receivable total revenue |
|
|
102,974,000 |
|
|
|
93,575,000 |
|
|
|
48,083,000 |
|
|
Average net funds employed |
|
|
497,867,000 |
|
|
|
447,358,000 |
|
|
|
243,583,000 |
|
|
Yield on average net funds employed |
|
|
20.68 |
% |
|
|
20.92 |
% |
|
|
19.74 |
% |
|
|
|
|
|
|
|
|
|
|
|
|
|
|
|
Accounts receivable purchased |
|
$ |
5,674,565,000 |
|
|
$ |
5,119,527,000 |
|
|
$ |
2,765,678,000 |
|
|
Number of invoices purchased |
|
|
3,451,559 |
|
|
|
2,897,148 |
|
|
|
1,810,345 |
|
|
Average invoice size |
|
$ |
1,644 |
|
|
$ |
1,767 |
|
|
$ |
1,516 |
|
|
Average invoice size - transportation |
|
$ |
1,508 |
|
|
$ |
1,662 |
|
|
$ |
1,460 |
|
|
Average invoice size - non-transportation |
|
$ |
3,404 |
|
|
$ |
2,906 |
|
|
$ |
1,991 |
|
Our Factoring segment’s operating income increased $11.3 million, or 43.4%.
Our average invoice size decreased 7.0% from $1,767 for the year ended December 31, 2018 to $1,644 for the year ended December 31, 2019; however, the number of invoices purchased increased 19.1% period over period.
Net interest income increased due to an 11.3% increase in overall average net funds employed (“NFE”) during year ended December 31, 2019 compared to the same period in 2018. The increase in NFE was the result of a full-year impact of the ICC acquisition as well as organic growth in the factored receivables portfolio. However, the Company believes this growth was offset in part by a decrease in transportation demand during 2019 as compared to 2018 due to a combination of macroeconomic factors that caused record demand in the transportation sector in 2018. Demand appears to have settled into a more traditional pattern throughout 2019. These macroeconomic factors influenced invoice prices and utilization, both of which impact NFE and period end balances in our factoring portfolio. Prior to 2019, intersegment interest was calculated based on the Company’s prime rate. Beginning in 2019, intersegment interest expense is allocated to the Factoring segment based on lower Federal Home Loan Bank advance rates which also contributed to the increase in the Factoring segment’s net interest income. In addition to increased purchases and despite some macroeconomic headwinds, yield on average net funds employed was relatively flat period over period as a result of higher yielding clients in the ICC book, and to a lesser extent more balances on which fees are charged on days outstanding. Our transportation factoring balances, which typically generate a higher yield than our non-transportation factoring balances, as a percentage of the overall Factoring segment portfolio were down 2% year over year from 83% during the year ended December 31, 2018 to 81% during the year ended December 31, 2019.
The decrease in provision for loan losses was primarily the result of lower growth in the ending balance of the factored receivables portfolio during the year ended December 31, 2019 compared to the same period in 2018. The ending balance of the factored receivables portfolio at our Factoring segment contracted $15.4 million during the year ended December 31, 2019 compared to ending balance growth of $242.5 million over the same time period in 2018 driven by the acquisition of ICC. We experienced higher total net charge-offs of $2.0 million in the year ended December 31, 2019 compared to $1.1 million for the same period in 2018. We had reserves on 2018 charge-offs of $0.5 million that were established in the prior period. There were no reserves previously established on 2019 chargeoffs. The decrease in provision for loan losses was also impacted by a $0.3 million decrease in net new allowances on specific at-risk balances at our Factoring segment to $1.2 million during the year ended December 31, 2019 from $1.5 million net new allowances on specific at-risk balances during the year ended December 31, 2018.
The increase in noninterest expense was driven primarily by increased personnel, operating and technology costs incurred in connection with a full-year impact of the ICC acquisition and growth in our factoring portfolio, particularly the increase in number of invoices processed period over period. Reflected in our Factoring segment’s noninterest expense for the nine months ended September 30, 2018 is $1.1 million in transaction costs related to the ICC acquisition. The increase in noninterest income was also the result of continued growth in our factoring operations.
54
Corporate
|
(Dollars in thousands) |
|
Years Ended December 31, |
|
|
2019 Compared to 2018 |
|
|
2018 Compared to 2017 |
|
|||||||||||||||||||
|
Corporate |
|
2019 |
|
|
2018 |
|
|
2017 |
|
|
$ Change |
|
|
% Change |
|
|
$ Change |
|
|
% Change |
|
|||||||
|
Total interest income |
|
$ |
1,164 |
|
|
$ |
2,013 |
|
|
$ |
1,398 |
|
|
$ |
(849 |
) |
|
|
(42.2 |
%) |
|
$ |
615 |
|
|
|
44.0 |
% |
|
Intersegment interest allocations |
|
|
— |
|
|
|
— |
|
|
|
— |
|
|
|
— |
|
|
|
— |
|
|
|
— |
|
|
|
— |
|
|
Total interest expense |
|
|
6,464 |
|
|
|
6,092 |
|
|
|
5,300 |
|
|
|
372 |
|
|
|
6.1 |
% |
|
|
792 |
|
|
|
14.9 |
% |
|
Net interest income (expense) |
|
|
(5,300 |
) |
|
|
(4,079 |
) |
|
|
(3,902 |
) |
|
|
(1,221 |
) |
|
|
(29.9 |
%) |
|
|
(177 |
) |
|
|
(4.5 |
%) |
|
Provision for loan losses |
|
|
(77 |
) |
|
|
(8 |
) |
|
|
91 |
|
|
|
(69 |
) |
|
|
(862.5 |
%) |
|
|
(99 |
) |
|
|
(108.8 |
%) |
|
Net interest income (expense) after provision |
|
|
(5,223 |
) |
|
|
(4,071 |
) |
|
|
(3,993 |
) |
|
|
(1,152 |
) |
|
|
(28.3 |
%) |
|
|
(78 |
) |
|
|
(2.0 |
%) |
|
Gain on sale of subsidiary or division |
|
|
— |
|
|
|
— |
|
|
|
20,860 |
|
|
|
— |
|
|
|
— |
|
|
|
(20,860 |
) |
|
|
(100.0 |
%) |
|
Other noninterest income |
|
|
(33 |
) |
|
|
52 |
|
|
|
2,723 |
|
|
|
(85 |
) |
|
|
(163.5 |
%) |
|
|
(2,671 |
) |
|
|
(98.1 |
%) |
|
Noninterest expense |
|
|
3,684 |
|
|
|
4,575 |
|
|
|
10,341 |
|
|
|
(891 |
) |
|
|
(19.5 |
%) |
|
|
(5,766 |
) |
|
|
(55.8 |
%) |
|
Operating income (loss) |
|
$ |
(8,940 |
) |
|
$ |
(8,594 |
) |
|
$ |
9,249 |
|
|
$ |
(346 |
) |
|
|
(4.0 |
%) |
|
$ |
(17,843 |
) |
|
|
(192.9 |
%) |
The Corporate segment reported an operating loss of $8.9 million for the year ended December 31, 2019 compared to an operating loss of $8.6 million for the year ended December 31, 2018. Included in the 2018 operating loss was $1.3 million of FBD and SCC-related transaction costs. There were no comparable costs recorded during the corresponding period of 2019. There were no other significant fluctuations in accounts in our Corporate segment period over period.
Financial Condition
Assets
Total assets were $5.060 billion at December 31, 2019, compared to $4.560 billion at December 31, 2018, an increase of $500.0 million, the components of which are discussed below.
Loan Portfolio
Loans held for investment were $4.195 billion at December 31, 2019, compared with $3.609 billion at December 31, 2018.
The following table shows the recorded investment of our loans by portfolio categories as of the dates indicated:
|
|
|
December 31, 2019 |
|
|
December 31, 2018 |
|
|
|
|
|
|
|
|
|
||||||||||
|
(Dollars in thousands) |
|
|
|
|
|
% of Total |
|
|
|
|
|
|
% of Total |
|
|
$ Change |
|
|
% Change |
|
||||
|
Commercial real estate |
|
$ |
1,046,961 |
|
|
|
25 |
% |
|
$ |
992,080 |
|
|
|
27 |
% |
|
$ |
54,881 |
|
|
|
5.5 |
% |
|
Construction, land development, land |
|
|
160,569 |
|
|
|
4 |
% |
|
|
179,591 |
|
|
|
5 |
% |
|
|
(19,022 |
) |
|
|
(10.6 |
%) |
|
1-4 family residential properties |
|
|
179,425 |
|
|
|
4 |
% |
|
|
190,185 |
|
|
|
5 |
% |
|
|
(10,760 |
) |
|
|
(5.7 |
%) |
|
Farmland |
|
|
154,975 |
|
|
|
4 |
% |
|
|
170,540 |
|
|
|
5 |
% |
|
|
(15,565 |
) |
|
|
(9.1 |
%) |
|
Commercial |
|
|
1,342,683 |
|
|
|
31 |
% |
|
|
1,114,971 |
|
|
|
31 |
% |
|
|
227,712 |
|
|
|
20.4 |
% |
|
Factored receivables |
|
|
619,986 |
|
|
|
15 |
% |
|
|
617,791 |
|
|
|
17 |
% |
|
|
2,195 |
|
|
|
0.4 |
% |
|
Consumer |
|
|
21,925 |
|
|
|
1 |
% |
|
|
29,822 |
|
|
|
1 |
% |
|
|
(7,897 |
) |
|
|
(26.5 |
%) |
|
Mortgage warehouse |
|
|
667,988 |
|
|
|
16 |
% |
|
|
313,664 |
|
|
|
9 |
% |
|
|
354,324 |
|
|
|
113.0 |
% |
|
Total loans |
|
$ |
4,194,512 |
|
|
|
100 |
% |
|
$ |
3,608,644 |
|
|
|
100 |
% |
|
$ |
585,868 |
|
|
|
16.2 |
% |
|
|
|
December 31, 2017 |
|
|
December 31, 2016 |
|
|
December 31, 2015 |
|
|||||||||||||||
|
(Dollars in thousands) |
|
|
|
|
|
% of Total |
|
|
|
|
|
|
% of Total |
|
|
|
|
|
|
% of Total |
|
|||
|
Commercial real estate |
|
$ |
745,893 |
|
|
|
27 |
% |
|
$ |
442,237 |
|
|
|
22 |
% |
|
$ |
291,819 |
|
|
|
23 |
% |
|
Construction, land development, land |
|
|
134,812 |
|
|
|
5 |
% |
|
|
109,812 |
|
|
|
5 |
% |
|
|
43,876 |
|
|
|
3 |
% |
|
1-4 family residential properties |
|
|
125,827 |
|
|
|
4 |
% |
|
|
104,974 |
|
|
|
5 |
% |
|
|
78,244 |
|
|
|
6 |
% |
|
Farmland |
|
|
180,141 |
|
|
|
6 |
% |
|
|
141,615 |
|
|
|
7 |
% |
|
|
33,573 |
|
|
|
3 |
% |
|
Commercial |
|
|
920,812 |
|
|
|
33 |
% |
|
|
778,643 |
|
|
|
39 |
% |
|
|
495,356 |
|
|
|
38 |
% |
|
Factored receivables |
|
|
374,410 |
|
|
|
13 |
% |
|
|
238,198 |
|
|
|
12 |
% |
|
|
215,088 |
|
|
|
17 |
% |
|
Consumer |
|
|
31,131 |
|
|
|
1 |
% |
|
|
29,764 |
|
|
|
1 |
% |
|
|
13,050 |
|
|
|
1 |
% |
|
Mortgage warehouse |
|
|
297,830 |
|
|
|
11 |
% |
|
|
182,381 |
|
|
|
9 |
% |
|
|
120,879 |
|
|
|
9 |
% |
|
Total loans |
|
$ |
2,810,856 |
|
|
|
100 |
% |
|
$ |
2,027,624 |
|
|
|
100 |
% |
|
$ |
1,291,885 |
|
|
|
100 |
% |
Commercial Real Estate Loans. Our commercial real estate loans increased $54.9 million, or 5.5%, due to new loan origination activity offset by paydowns for the year.
55
Construction and Development Loans. Our construction and development loans decreased $19.0 million, or 10.6%, due to paydowns and conversion of certain construction and development loans to commercial real estate loans at construction completion. The decrease was slightly offset by origination activity during the year.
Residential Real Estate Loans. Our one-to-four family residential loans decreased $10.8 million, or 5.7%, due to paydowns that were offset by modest origination activity.
Farmland Loans. Our farmland loans decreased $15.6 million, or 9.1%, due to paydowns for the year that outpaced new loan origination activity.
Commercial Loans. Our commercial loans held for investment increased $227.7 million, or 20.4%, primarily due to growth in equipment finance loans, liquid credit, and premium finance loans as we continue to execute on our growth strategy for such products. Our other commercial lending products, comprised primarily of general commercial loans originated in our community banking markets, also increased by $71.2 million, or 21.4%, as a result of organic growth. Commercial loan growth was partially offset by declines in asset-based lending and agriculture.
The following table shows our commercial loans:
|
(Dollars in thousands) |
|
December 31, 2019 |
|
|
December 31, 2018 |
|
|
$ Change |
|
|
% Change |
|
||||
|
Commercial |
|
|
|
|
|
|
|
|
|
|
|
|
|
|
|
|
|
Equipment |
|
$ |
461,555 |
|
|
$ |
352,037 |
|
|
$ |
109,518 |
|
|
|
31.1 |
% |
|
Asset-based lending |
|
|
168,955 |
|
|
|
214,110 |
|
|
|
(45,155 |
) |
|
|
(21.1 |
%) |
|
Liquid credit |
|
|
81,353 |
|
|
|
963 |
|
|
|
80,390 |
|
|
|
8347.9 |
% |
|
Premium finance |
|
|
101,015 |
|
|
|
72,302 |
|
|
|
28,713 |
|
|
|
39.7 |
% |
|
Agriculture |
|
|
125,912 |
|
|
|
142,881 |
|
|
|
(16,969 |
) |
|
|
(11.9 |
%) |
|
Other commercial lending |
|
|
403,893 |
|
|
|
332,678 |
|
|
|
71,215 |
|
|
|
21.4 |
% |
|
Total commercial loans |
|
$ |
1,342,683 |
|
|
$ |
1,114,971 |
|
|
$ |
227,712 |
|
|
|
20.4 |
% |
Factored Receivables. Our factored receivables increased $2.2 million, or 0.4%. See discussion of our factoring subsidiary in the Operating Segment Results for analysis of the key drivers impacting the change in the ending factored receivables balance during the year.
Consumer Loans. Our consumer loans decreased $7.9 million, or 26.5%, due to paydowns in excess of new loan origination activity during the year.
Mortgage Warehouse. Our mortgage warehouse facilities increased $354.3 million, or 113.0%, due to higher utilization of our clients’ mortgage warehouse facilities during the year. Client utilization of mortgage warehouse facilities can experience significant fluctuation on a day-to-day basis given mortgage origination market conditions. Our average mortgage warehouse lending balance was $370.4 million for the year ended December 31, 2019 compared to $242.9 million for the year ended December 31, 2018.
56
The following table sets forth the contractual maturities, including scheduled principal repayments, of our loan portfolio and the distribution between fixed and floating interest rate loans:
|
|
|
December 31, 2019 |
|
|||||||||||||
|
(Dollars in thousands) |
|
One Year or Less |
|
|
After One but within Five Years |
|
|
After Five Years |
|
|
Total |
|
||||
|
Commercial real estate |
|
$ |
168,504 |
|
|
$ |
613,130 |
|
|
$ |
265,327 |
|
|
$ |
1,046,961 |
|
|
Construction, land development, land |
|
|
50,425 |
|
|
|
93,603 |
|
|
|
16,541 |
|
|
|
160,569 |
|
|
1-4 family residential properties |
|
|
21,112 |
|
|
|
43,776 |
|
|
|
114,537 |
|
|
|
179,425 |
|
|
Farmland |
|
|
11,963 |
|
|
|
56,117 |
|
|
|
86,895 |
|
|
|
154,975 |
|
|
Commercial |
|
|
479,436 |
|
|
|
767,324 |
|
|
|
95,923 |
|
|
|
1,342,683 |
|
|
Factored receivables |
|
|
619,986 |
|
|
|
— |
|
|
|
— |
|
|
|
619,986 |
|
|
Consumer |
|
|
3,525 |
|
|
|
11,260 |
|
|
|
7,140 |
|
|
|
21,925 |
|
|
Mortgage warehouse |
|
|
667,988 |
|
|
|
— |
|
|
|
— |
|
|
|
667,988 |
|
|
|
|
$ |
2,022,939 |
|
|
$ |
1,585,210 |
|
|
$ |
586,363 |
|
|
$ |
4,194,512 |
|
|
|
|
|
|
|
|
|
|
|
|
|
|
|
|
|
|
|
|
Sensitivity of loans to changes in interest rates: |
|
|
|
|
|
|
|
|
|
|
|
|
|
|
|
|
|
Predetermined (fixed) interest rates |
|
|
|
|
|
$ |
1,034,798 |
|
|
$ |
133,471 |
|
|
|
|
|
|
Floating interest rates |
|
|
|
|
|
|
550,412 |
|
|
|
452,892 |
|
|
|
|
|
|
Total |
|
|
|
|
|
$ |
1,585,210 |
|
|
$ |
586,363 |
|
|
|
|
|
As of December 31, 2019, most of the Company’s non-factoring lending activity is with customers located within certain states. The states of Texas (27%), Colorado (23%), Illinois (13%), and Iowa (7%) make up 70% of the Company’s gross loans, excluding factored receivables. Therefore, the Company’s exposure to credit risk is affected by changes in the economies in these states. At December 31, 2018, the states of Texas (24%), Colorado (27%), Illinois (15%) and Iowa (7%) made up 73% of the Company’s gross loans, excluding factored receivables.
Further, a majority (77%) of our factored receivables, representing approximately 11% of our total loan portfolio as of December 31, 2019, are transportation receivables. Although such concentration may cause our future income with respect to our factoring operations to be correlated with demand for the transportation industry in the United States generally, and small-to-mid-sized operators in such industry specifically, we feel the credit risk with respect to our outstanding portfolio is appropriately mitigated as we limit the amount of receivables acquired from individual debtors and creditors thereby achieving diversification across a number of companies and industries. At December 31, 2018, 79% of our factored receivables, representing approximately 14% of our total loan portfolio, were transportation receivables.
Nonperforming Assets
We have established procedures to assist us in maintaining the overall quality of our loan portfolio. In addition, we have adopted underwriting guidelines to be followed by our lending officers and require senior management review of proposed extensions of credit exceeding certain thresholds. When delinquencies exist, we monitor them for any negative or adverse trends. Our loan review procedures include approval of lending policies and underwriting guidelines by the Board of Directors of our bank subsidiary, independent loan review, approval of large credit relationships by our bank subsidiary’s Management Loan Committee and loan quality documentation procedures. We, like other financial institutions, are subject to the risk that our loan portfolio will be subject to increasing pressures from deteriorating borrower credit due to general economic conditions.
57
The following table sets forth the allocation of our nonperforming assets among our different asset categories as of the dates indicated. We classify nonperforming assets as nonperforming loans, OREO, other repossessed assets and nonaccrual loans included in assets held for sale. Nonperforming loans consist of nonaccrual loans (including nonaccrual PCI loans), troubled debt restructurings (“TDRs”), and factored receivables greater than 90 days past due. The balances of nonperforming loans reflect the recorded investment in these assets, including deductions for purchase discounts.
|
|
|
December 31, |
|
|
December 31, |
|
||
|
(Dollars in thousands) |
|
2019 |
|
|
2018 |
|
||
|
Nonperforming loans: |
|
|
|
|
|
|
|
|
|
Commercial real estate |
|
$ |
7,455 |
|
|
$ |
7,096 |
|
|
Construction, land development, land |
|
|
2,138 |
|
|
|
91 |
|
|
1-4 family residential properties |
|
|
1,721 |
|
|
|
1,672 |
|
|
Farmland |
|
|
6,611 |
|
|
|
4,059 |
|
|
Commercial |
|
|
15,603 |
|
|
|
17,104 |
|
|
Factored receivables |
|
|
4,226 |
|
|
|
2,152 |
|
|
Consumer |
|
|
327 |
|
|
|
355 |
|
|
Mortgage Warehouse |
|
|
— |
|
|
|
— |
|
|
Purchased credit impaired |
|
|
2,532 |
|
|
|
3,525 |
|
|
Total nonperforming loans |
|
|
40,613 |
|
|
|
36,054 |
|
|
Other real estate owned, net |
|
|
3,009 |
|
|
|
2,060 |
|
|
Other repossessed assets |
|
|
476 |
|
|
|
165 |
|
|
Total nonperforming assets |
|
$ |
44,098 |
|
|
$ |
38,279 |
|
|
|
|
|
|
|
|
|
|
|
|
Nonperforming assets to total assets |
|
|
0.87 |
% |
|
|
0.84 |
% |
|
Nonperforming loans to total loans held for investment |
|
|
0.97 |
% |
|
|
1.00 |
% |
|
Total past due loans to total loans held for investment |
|
|
2.19 |
% |
|
|
2.41 |
% |
Nonperforming loans, including nonaccrual PCI loans, increased $4.6 million, or 12.6%, primarily due to the additions of three commercial real estate loan relationships totaling $4.3 million, two commercial loan relationships secured by equipment, totaling $3.5 million, a $2.1 million farmland relationship, and a $1.8 million real estate construction relationship to nonaccrual during the year. Further factored receivables greater than 90 days past due increased $2.1 million during the year. These increases in nonperforming loans were partially offset by the removal of a $3.6 million nonaccrual asset based lending loan that was paid in full during the year and a $1.7 million real estate construction loan that was also paid in full during the year. Also offsetting the increase in nonperforming loans is a partial paydown of $3.3 million as part of a troubled debt restructuring on a commercial loan relationship. The restructured loan relationship has a remaining book balance of $1.8 million and carries a 90% government guarantee. The remaining activity in nonperforming loans was also impacted by additions and removals of smaller credits to and from nonperforming loans.
OREO increased $0.9 million, or 46.1%, due to the addition of individually insignificant OREO properties as well as valuation adjustments made throughout the year.
As a result of the above activity and growth in our total assets and total loans held for investment, the ratio of nonperforming loans to total loans held for investment decreased to 0.97% at December 31, 2019 compared to 1.00% at December 31, 2018, and our ratio of nonperforming assets to total assets increased to 0.87% at December 31, 2019 compared to 0.84% at December 31, 2018.
Past due loans to total loans held for investment decreased to 2.19% at December 31, 2019 compared to 2.41% at December 31, 2018, primarily as a result of above activity and change in our total loan balance.
The following table presents nonperforming and past due loans for the periods indicated:
|
|
|
December 31, |
|
|||||||||||||||||
|
(Dollars in thousands) |
|
2019 |
|
|
2018 |
|
|
2017 |
|
|
2016 |
|
|
2015 |
|
|||||
|
Nonaccrual loans |
|
$ |
36,054 |
|
|
$ |
30,785 |
|
|
$ |
32,149 |
|
|
$ |
38,030 |
|
|
$ |
10,094 |
|
|
Factored receivables greater than 90 days past due |
|
|
4,226 |
|
|
|
2,152 |
|
|
|
1,454 |
|
|
|
2,153 |
|
|
|
1,931 |
|
|
Troubled debt restructurings accruing interest |
|
|
333 |
|
|
|
3,117 |
|
|
|
5,128 |
|
|
|
5,123 |
|
|
|
1,330 |
|
|
Total nonperforming loans |
|
$ |
40,613 |
|
|
$ |
36,054 |
|
|
$ |
38,731 |
|
|
$ |
45,306 |
|
|
$ |
13,355 |
|
|
|
|
|
|
|
|
|
|
|
|
|
|
|
|
|
|
|
|
|
|
|
|
Total loans greater than 90 days past due accruing interest |
|
$ |
4,226 |
|
|
$ |
3,559 |
|
|
$ |
1,664 |
|
|
$ |
3,621 |
|
|
$ |
1,940 |
|
58
Potential problem loans consist of loans that are performing in accordance with contractual terms but for which management has concerns about the ability of an obligor to continue to comply with repayment terms because of the obligor’s potential operating or financial difficulties. Management monitors these loans and reviews their performance on a regular basis. Potential problem loans contain potential weaknesses that could improve, persist or further deteriorate. At December 31, 2019, we had $28.1 million in loans of this type which are not included in any of the nonperforming loan categories. All of the loans identified as potential problem loans at December 31, 2019 were graded as “substandard”.
Analysis of the Allowance for Loan and Lease Losses
The ALLL is a valuation allowance for probable incurred credit losses. Loan losses are charged against the ALLL when management believes the uncollectability of a loan balance is confirmed. Subsequent recoveries, if any, are credited to the ALLL. Management estimates the ALLL balance required using past loan loss experience, the nature and volume of the portfolio, information about specific borrower situations and estimated collateral values, economic conditions and other factors. Allocations of the ALLL may be made for specific loans, but the entire allowance is available for any loan that, in management’s judgment, should be charged-off.
In addition, the product types associated with fluctuations within the loan portfolio also contribute to the allowance allocation, as different loan products require different levels of ALLL based upon their credit risk characteristics. Loan loss valuation allowances are recorded on specific at-risk balances, typically consisting of impaired loans and factored invoices greater than 90 days past due with negative cash reserves.
Under accounting standards for business combinations, acquired loans are recorded at fair value on the date of acquisition. This fair value adjustment eliminates any of the seller’s ALLL associated with such loans as of the purchase date as any credit exposure associated with such loans is incorporated into the fair value adjustment. A provision for loan losses is recorded for the emergence of new incurred and estimable losses on acquired loans after the acquisition date in excess of the recorded discount.
The following table sets forth the ALLL by category of loan:
|
|
|
December 31, 2019 |
|
|
December 31, 2018 |
|
||||||||||||||||||
|
(Dollars in thousands) |
|
Allocated Allowance |
|
|
% of Loan Portfolio |
|
|
ALLL to Loans |
|
|
Allocated Allowance |
|
|
% of Loan Portfolio |
|
|
ALLL to Loans |
|
||||||
|
Commercial real estate |
|
$ |
5,353 |
|
|
|
25 |
% |
|
|
0.51 |
% |
|
$ |
4,493 |
|
|
|
27 |
% |
|
|
0.45 |
% |
|
Construction, land development, land |
|
|
1,382 |
|
|
|
4 |
% |
|
|
0.86 |
% |
|
|
1,134 |
|
|
|
5 |
% |
|
|
0.63 |
% |
|
1-4 family residential properties |
|
|
308 |
|
|
|
4 |
% |
|
|
0.17 |
% |
|
|
317 |
|
|
|
5 |
% |
|
|
0.17 |
% |
|
Farmland |
|
|
670 |
|
|
|
4 |
% |
|
|
0.43 |
% |
|
|
535 |
|
|
|
5 |
% |
|
|
0.31 |
% |
|
Commercial |
|
|
12,566 |
|
|
|
31 |
% |
|
|
0.94 |
% |
|
|
12,865 |
|
|
|
31 |
% |
|
|
1.15 |
% |
|
Factored receivables |
|
|
7,657 |
|
|
|
15 |
% |
|
|
1.24 |
% |
|
|
7,299 |
|
|
|
17 |
% |
|
|
1.18 |
% |
|
Consumer |
|
|
488 |
|
|
|
1 |
% |
|
|
2.23 |
% |
|
|
615 |
|
|
|
1 |
% |
|
|
2.06 |
% |
|
Mortgage warehouse |
|
|
668 |
|
|
|
16 |
% |
|
|
0.10 |
% |
|
|
313 |
|
|
|
9 |
% |
|
|
0.10 |
% |
|
Total loans |
|
$ |
29,092 |
|
|
|
100 |
% |
|
|
0.69 |
% |
|
$ |
27,571 |
|
|
|
100 |
% |
|
|
0.76 |
% |
|
|
|
December 31, 2017 |
|
|
December 31, 2016 |
|
|
December 31, 2015 |
|
|||||||||||||||||||||||||||
|
(Dollars in thousands) |
|
Allocated Allowance |
|
|
% of Loan Portfolio |
|
|
ALLL to Loans |
|
|
Allocated Allowance |
|
|
% of Loan Portfolio |
|
|
ALLL to Loans |
|
|
Allocated Allowance |
|
|
% of Loan Portfolio |
|
|
ALLL to Loans |
|
|||||||||
|
Commercial real estate |
|
$ |
3,435 |
|
|
|
27 |
% |
|
|
0.46 |
% |
|
$ |
1,813 |
|
|
|
22 |
% |
|
|
0.41 |
% |
|
$ |
1,489 |
|
|
|
23 |
% |
|
|
0.51 |
% |
|
Construction, land development, land |
|
|
883 |
|
|
|
5 |
% |
|
|
0.65 |
% |
|
|
465 |
|
|
|
5 |
% |
|
|
0.42 |
% |
|
|
367 |
|
|
|
3 |
% |
|
|
0.84 |
% |
|
1-4 family residential properties |
|
|
293 |
|
|
|
4 |
% |
|
|
0.23 |
% |
|
|
253 |
|
|
|
5 |
% |
|
|
0.24 |
% |
|
|
274 |
|
|
|
6 |
% |
|
|
0.35 |
% |
|
Farmland |
|
|
310 |
|
|
|
6 |
% |
|
|
0.17 |
% |
|
|
170 |
|
|
|
7 |
% |
|
|
0.12 |
% |
|
|
134 |
|
|
|
3 |
% |
|
|
0.40 |
% |
|
Commercial |
|
|
8,150 |
|
|
|
33 |
% |
|
|
0.89 |
% |
|
|
8,014 |
|
|
|
39 |
% |
|
|
1.03 |
% |
|
|
5,276 |
|
|
|
38 |
% |
|
|
1.07 |
% |
|
Factored receivables |
|
|
4,597 |
|
|
|
13 |
% |
|
|
1.23 |
% |
|
|
4,088 |
|
|
|
12 |
% |
|
|
1.72 |
% |
|
|
4,509 |
|
|
|
17 |
% |
|
|
2.10 |
% |
|
Consumer |
|
|
783 |
|
|
|
1 |
% |
|
|
2.52 |
% |
|
|
420 |
|
|
|
1 |
% |
|
|
1.41 |
% |
|
|
216 |
|
|
|
1 |
% |
|
|
1.66 |
% |
|
Mortgage warehouse |
|
|
297 |
|
|
|
11 |
% |
|
|
0.10 |
% |
|
|
182 |
|
|
|
9 |
% |
|
|
0.10 |
% |
|
|
302 |
|
|
|
9 |
% |
|
|
0.25 |
% |
|
Total loans |
|
$ |
18,748 |
|
|
|
100 |
% |
|
|
0.67 |
% |
|
$ |
15,405 |
|
|
|
100 |
% |
|
|
0.76 |
% |
|
$ |
12,567 |
|
|
|
100 |
% |
|
|
0.97 |
% |
The ALLL increased $1.5 million, or 5.5%, which was driven by $6.4 million of net charge-offs (which carried a reserve of $1.7 million at the time of charge-off), $2.2 million of net new specific allowances recorded on impaired loans and growth in the underlying portfolio during the year ended December 31, 2019. The change in the ALLL during the period was also impacted by changes in the mix of our loan portfolio as well as changes to loss factors.
59
The following table presents the unpaid principal and recorded investment for loans at December 31, 2019. The difference between the unpaid principal balance and recorded investment is principally (1) premiums and discounts associated with acquisition date fair value adjustments on acquired loans (both PCI and non-PCI) totaling $13.6 million and (2) net deferred origination and factoring fees totaling $1.4 million. The net difference can provide protection from credit loss in addition to the ALLL as future potential charge-offs for an individual loan are limited to the recorded investment plus unpaid accrued interest.
|
(Dollars in thousands) |
|
Recorded |
|
|
Unpaid |
|
|
|
|
|
||
|
December 31, 2019 |
|
Investment |
|
|
Principal |
|
|
Difference |
|
|||
|
Commercial real estate |
|
$ |
1,046,961 |
|
|
$ |
1,051,684 |
|
|
$ |
(4,723 |
) |
|
Construction, land development, land |
|
|
160,569 |
|
|
|
162,335 |
|
|
|
(1,766 |
) |
|
1-4 family residential properties |
|
|
179,425 |
|
|
|
180,340 |
|
|
|
(915 |
) |
|
Farmland |
|
|
154,975 |
|
|
|
156,995 |
|
|
|
(2,020 |
) |
|
Commercial |
|
|
1,342,683 |
|
|
|
1,346,444 |
|
|
|
(3,761 |
) |
|
Factored receivables |
|
|
619,986 |
|
|
|
621,697 |
|
|
|
(1,711 |
) |
|
Consumer |
|
|
21,925 |
|
|
|
21,994 |
|
|
|
(69 |
) |
|
Mortgage warehouse |
|
|
667,988 |
|
|
|
667,988 |
|
|
|
— |
|
|
|
|
$ |
4,194,512 |
|
|
$ |
4,209,477 |
|
|
$ |
(14,965 |
) |
At December 31, 2019 and 2018, we had $66.8 million and $58.6 million, respectively, of customer reserves associated with factored receivables which represent customer reserves held to settle any payment disputes or collection shortfalls, may be used to pay customers’ obligations to various third parties as directed by the customer, are periodically released to or withdrawn by customers, and are reported as deposits on our consolidated balance sheets.
60
The following table provides an analysis of the provisions for loan losses, net charge-offs and recoveries, and the effects of those items on our ALLL:
|
|
|
Years Ended December 31, |
|
|||||||||||||||||
|
(Dollars in thousands) |
|
2019 |
|
|
2018 |
|
|
2017 |
|
|
2016 |
|
|
2015 |
|
|||||
|
Balance at beginning of period |
|
$ |
27,571 |
|
|
$ |
18,748 |
|
|
$ |
15,405 |
|
|
$ |
12,567 |
|
|
$ |
8,843 |
|
|
Loans charged-off: |
|
|
|
|
|
|
|
|
|
|
|
|
|
|
|
|
|
|
|
|
|
Commercial real estate |
|
|
(304 |
) |
|
|
(90 |
) |
|
|
(259 |
) |
|
|
(5 |
) |
|
|
(152 |
) |
|
Construction, land development, land |
|
|
(78 |
) |
|
|
(59 |
) |
|
|
(582 |
) |
|
|
— |
|
|
|
— |
|
|
1-4 family residential properties |
|
|
(141 |
) |
|
|
(17 |
) |
|
|
(31 |
) |
|
|
(84 |
) |
|
|
(205 |
) |
|
Farmland |
|
|
(265 |
) |
|
|
(200 |
) |
|
|
— |
|
|
|
— |
|
|
|
— |
|
|
Commercial |
|
|
(3,326 |
) |
|
|
(5,855 |
) |
|
|
(4,875 |
) |
|
|
(3,643 |
) |
|
|
(145 |
) |
|
Factored receivables |
|
|
(2,494 |
) |
|
|
(1,224 |
) |
|
|
(1,667 |
) |
|
|
(856 |
) |
|
|
(540 |
) |
|
Consumer |
|
|
(876 |
) |
|
|
(989 |
) |
|
|
(1,004 |
) |
|
|
(564 |
) |
|
|
(347 |
) |
|
Mortgage warehouse |
|
|
— |
|
|
|
— |
|
|
|
— |
|
|
|
— |
|
|
|
— |
|
|
Total loans charged-off |
|
$ |
(7,484 |
) |
|
$ |
(8,434 |
) |
|
$ |
(8,418 |
) |
|
$ |
(5,152 |
) |
|
$ |
(1,389 |
) |
|
Recoveries of loans charged-off: |
|
|
|
|
|
|
|
|
|
|
|
|
|
|
|
|
|
|
|
|
|
Commercial real estate |
|
$ |
1 |
|
|
$ |
104 |
|
|
$ |
59 |
|
|
$ |
16 |
|
|
$ |
53 |
|
|
Construction, land development, land |
|
|
92 |
|
|
|
17 |
|
|
|
175 |
|
|
|
6 |
|
|
|
— |
|
|
1-4 family residential properties |
|
|
61 |
|
|
|
18 |
|
|
|
47 |
|
|
|
85 |
|
|
|
204 |
|
|
Farmland |
|
|
— |
|
|
|
— |
|
|
|
— |
|
|
|
— |
|
|
|
— |
|
|
Commercial |
|
|
447 |
|
|
|
518 |
|
|
|
1,329 |
|
|
|
991 |
|
|
|
43 |
|
|
Factored receivables |
|
|
296 |
|
|
|
69 |
|
|
|
118 |
|
|
|
120 |
|
|
|
79 |
|
|
Consumer |
|
|
166 |
|
|
|
364 |
|
|
|
508 |
|
|
|
79 |
|
|
|
205 |
|
|
Mortgage warehouse |
|
|
— |
|
|
|
— |
|
|
|
— |
|
|
|
— |
|
|
|
— |
|
|
Total loans recoveries |
|
$ |
1,063 |
|
|
$ |
1,090 |
|
|
$ |
2,236 |
|
|
$ |
1,297 |
|
|
$ |
584 |
|
|
Net loans charged-off |
|
$ |
(6,421 |
) |
|
$ |
(7,344 |
) |
|
$ |
(6,182 |
) |
|
$ |
(3,855 |
) |
|
$ |
(805 |
) |
|
Provision for (reversal of) loan losses: |
|
|
|
|
|
|
|
|
|
|
|
|
|
|
|
|
|
|
|
|
|
Commercial real estate |
|
$ |
1,163 |
|
|
$ |
1,044 |
|
|
$ |
1,822 |
|
|
$ |
313 |
|
|
$ |
1,055 |
|
|
Construction, land development, land |
|
|
234 |
|
|
|
293 |
|
|
|
825 |
|
|
|
92 |
|
|
|
34 |
|
|
1-4 family residential properties |
|
|
71 |
|
|
|
23 |
|
|
|
24 |
|
|
|
(22 |
) |
|
|
60 |
|
|
Farmland |
|
|
400 |
|
|
|
425 |
|
|
|
140 |
|
|
|
36 |
|
|
|
115 |
|
|
Commercial |
|
|
2,580 |
|
|
|
10,052 |
|
|
|
5,785 |
|
|
|
5,390 |
|
|
|
1,375 |
|
|
Factored receivables |
|
|
2,556 |
|
|
|
3,857 |
|
|
|
2,058 |
|
|
|
315 |
|
|
|
1,508 |
|
|
Consumer |
|
|
583 |
|
|
|
457 |
|
|
|
859 |
|
|
|
689 |
|
|
|
218 |
|
|
Mortgage warehouse |
|
|
355 |
|
|
|
16 |
|
|
|
115 |
|
|
|
(120 |
) |
|
|
164 |
|
|
Total provision for (reversal of) loan losses |
|
$ |
7,942 |
|
|
$ |
16,167 |
|
|
$ |
11,628 |
|
|
$ |
6,693 |
|
|
$ |
4,529 |
|
|
Allowance transferred to assets held for sale |
|
|
— |
|
|
|
— |
|
|
|
(2,103 |
) |
|
|
— |
|
|
|
— |
|
|
Balance at end of period |
|
$ |
29,092 |
|
|
$ |
27,571 |
|
|
$ |
18,748 |
|
|
$ |
15,405 |
|
|
$ |
12,567 |
|
|
|
|
|
|
|
|
|
|
|
|
|
|
|
|
|
|
|
|
|
|
|
|
Average total loans held for investment |
|
$ |
3,827,754 |
|
|
$ |
3,130,731 |
|
|
$ |
2,235,481 |
|
|
$ |
1,549,788 |
|
|
$ |
1,106,489 |
|
|
Net charge-offs to average total loans held for investment |
|
|
0.17 |
% |
|
|
0.23 |
% |
|
|
0.28 |
% |
|
|
0.25 |
% |
|
|
0.07 |
% |
|
Allowance to total loans held for investment |
|
|
0.69 |
% |
|
|
0.76 |
% |
|
|
0.67 |
% |
|
|
0.76 |
% |
|
|
0.97 |
% |
Net loans charged off decreased $0.9 million, or 12.6%, primarily due to a $4.8 million charge-off on a single asset based lending relationship during the year ended December 31, 2018. There were no individually significant loan charge-offs or recoveries during the year ended December 31, 2019. The decrease in net charge-offs was partially offset by an increase in net charge-offs on factored receivables from $1.2 million during the year ended December 31, 2018 to $2.2 million during the year ended December 31, 2019.
61
Securities
The following table sets forth the composition of our securities portfolio by type:
|
|
|
December 31, 2019 |
|
|
December 31, 2018 |
|
|
December 31, 2017 |
|
|||||||||||||||
|
(Dollars in thousands) |
|
Amortized Cost |
|
|
Fair Value |
|
|
Amortized Cost |
|
|
Fair Value |
|
|
Amortized Cost |
|
|
Fair Value |
|
||||||
|
Available for sale securities: |
|
|
|
|
|
|
|
|
|
|
|
|
|
|
|
|
|
|
|
|
|
|
|
|
|
U.S. Government agency obligations |
|
$ |
39,679 |
|
|
$ |
39,760 |
|
|
$ |
93,500 |
|
|
$ |
92,648 |
|
|
$ |
110,531 |
|
|
$ |
109,890 |
|
|
U.S. Treasury notes |
|
|
— |
|
|
|
— |
|
|
|
1,956 |
|
|
|
1,932 |
|
|
|
1,940 |
|
|
|
1,934 |
|
|
Mortgage-backed securities, residential |
|
|
37,324 |
|
|
|
38,016 |
|
|
|
39,971 |
|
|
|
39,736 |
|
|
|
33,537 |
|
|
|
33,663 |
|
|
Asset backed securities |
|
|
8,039 |
|
|
|
7,959 |
|
|
|
10,165 |
|
|
|
10,145 |
|
|
|
11,883 |
|
|
|
11,845 |
|
|
State and municipal |
|
|
31,746 |
|
|
|
32,065 |
|
|
|
118,826 |
|
|
|
118,451 |
|
|
|
74,684 |
|
|
|
74,391 |
|
|
CLO Securities |
|
|
75,592 |
|
|
|
75,273 |
|
|
|
— |
|
|
|
— |
|
|
|
— |
|
|
|
— |
|
|
Corporate bonds |
|
|
50,889 |
|
|
|
51,583 |
|
|
|
68,804 |
|
|
|
68,787 |
|
|
|
15,271 |
|
|
|
15,320 |
|
|
SBA pooled securities |
|
|
4,112 |
|
|
|
4,164 |
|
|
|
4,766 |
|
|
|
4,724 |
|
|
|
3,535 |
|
|
|
3,560 |
|
|
Total available for sale securities |
|
$ |
247,381 |
|
|
$ |
248,820 |
|
|
$ |
337,988 |
|
|
$ |
336,423 |
|
|
$ |
251,381 |
|
|
$ |
250,603 |
|
|
|
|
|
|
|
|
|
|
|
|
|
|
|
|
|
|
|
|
|
|
|
|
|
|
|
|
Held to maturity securities: |
|
|
|
|
|
|
|
|
|
|
|
|
|
|
|
|
|
|
|
|
|
|
|
|
|
CLO securities |
|
$ |
8,417 |
|
|
$ |
6,907 |
|
|
$ |
8,487 |
|
|
$ |
7,326 |
|
|
$ |
8,557 |
|
|
$ |
7,527 |
|
|
|
|
|
|
|
|
|
|
|
|
|
|
|
|
|
|
|
|
|
|
|
|
|
|
|
|
Equity securities: |
|
|
|
|
|
|
|
|
|
|
|
|
|
|
|
|
|
|
|
|
|
|
|
|
|
Mutual fund |
|
|
|
|
|
$ |
5,437 |
|
|
|
|
|
|
$ |
5,044 |
|
|
|
|
|
|
$ |
5,006 |
|
As of December 31, 2019, we held securities classified as available for sale with a fair value of $248.8 million, a decrease of $87.6 million from $336.4 million at December 31, 2018. The decrease is primarily attributable to the sale of lower yielding state and municipal securities which were partially replaced by higher yielding investment grade CLO securities during the year ended December 31, 2019. Additionally, U.S. Government agency obligations experienced a decrease of $53.8 million on a fair value basis driven by run-off in the portfolio with no replacement activity. Remaining activity in our available for sale debt security portfolio during the period was not significant. Our available for sale securities can be used for pledging to secure FHLB borrowings and public deposits, or can be sold to meet liquidity needs.
As of December 31, 2019, we held securities classified as held to maturity with an amortized cost of $8.4 million, a decrease of $0.1 million from $8.5 million at December 31, 2018. These held to maturity securities represent a minority investment in the unrated subordinated notes of CLOs managed by Trinitas Capital Management.
As of December 31, 2019, we held equity securities with a fair value of $5.4 million, an increase of $0.4 million from $5.0 million at December 31, 2018. These securities represent investments in a publicly traded Community Reinvestment Act mutual fund and are subject to market pricing volatility, with changes in fair value recorded in earnings.
The following tables set forth the amortized cost and average yield of our securities, by type and contractual maturity:
|
|
|
Maturity as of December 31, 2019 |
|
|||||||||||||||||||||||||||||||||||||
|
|
|
1 Year or Less |
|
|
1 to 5 Years |
|
|
5 to 10 Years |
|
|
Over 10 Years |
|
|
Total |
|
|||||||||||||||||||||||||
|
|
|
Amortized |
|
|
Average |
|
|
Amortized |
|
|
Average |
|
|
Amortized |
|
|
Average |
|
|
Amortized |
|
|
Average |
|
|
Amortized |
|
|
Average |
|
||||||||||
|
(Dollars in thousands) |
|
Cost |
|
|
Yield |
|
|
Cost |
|
|
Yield |
|
|
Cost |
|
|
Yield |
|
|
Cost |
|
|
Yield |
|
|
Cost |
|
|
Yield |
|
||||||||||
|
U.S. Government agency obligations |
|
$ |
24,843 |
|
|
|
1.62 |
% |
|
$ |
14,836 |
|
|
|
2.03 |
% |
|
$ |
— |
|
|
|
— |
|
|
$ |
— |
|
|
|
— |
|
|
$ |
39,679 |
|
|
|
1.77 |
% |
|
Mortgage-backed securities, residential |
|
|
7 |
|
|
|
2.38 |
% |
|
|
2,752 |
|
|
|
2.02 |
% |
|
|
8,660 |
|
|
|
2.30 |
% |
|
|
25,905 |
|
|
|
3.10 |
% |
|
|
37,324 |
|
|
|
2.83 |
% |
|
Asset backed securities |
|
|
12 |
|
|
|
1.72 |
% |
|
|
594 |
|
|
|
2.24 |
% |
|
|
5,240 |
|
|
|
2.15 |
% |
|
|
2,193 |
|
|
|
3.13 |
% |
|
|
8,039 |
|
|
|
2.43 |
% |
|
State and municipal |
|
|
13,427 |
|
|
|
2.63 |
% |
|
|
7,247 |
|
|
|
2.89 |
% |
|
|
7,844 |
|
|
|
1.88 |
% |
|
|
3,228 |
|
|
|
2.29 |
% |
|
|
31,746 |
|
|
|
2.48 |
% |
|
CLO Securities |
|
|
— |
|
|
|
— |
|
|
|
— |
|
|
|
— |
|
|
|
2,916 |
|
|
|
3.94 |
% |
|
|
72,676 |
|
|
|
4.20 |
% |
|
|
75,592 |
|
|
|
4.19 |
% |
|
Corporate bonds |
|
|
31,954 |
|
|
|
3.39 |
% |
|
|
18,662 |
|
|
|
3.88 |
% |
|
|
— |
|
|
|
— |
|
|
|
273 |
|
|
|
5.13 |
% |
|
|
50,889 |
|
|
|
3.58 |
% |
|
SBA pooled securities |
|
|
— |
|
|
|
— |
|
|
|
53 |
|
|
|
4.34 |
% |
|
|
3 |
|
|
|
4.37 |
% |
|
|
4,056 |
|
|
|
4.10 |
% |
|
|
4,112 |
|
|
|
4.10 |
% |
|
Total securities available for sale |
|
$ |
70,243 |
|
|
|
2.62 |
% |
|
$ |
44,144 |
|
|
|
2.96 |
% |
|
$ |
24,663 |
|
|
|
2.33 |
% |
|
$ |
108,331 |
|
|
|
3.86 |
% |
|
$ |
247,381 |
|
|
|
3.20 |
% |
|
|
|
|
|
|
|
|
|
|
|
|
|
|
|
|
|
|
|
|
|
|
|
|
|
|
|
|
|
|
|
|
|
|
|
|
|
|
|
|
|
|
|
Securities held-to-maturity |
|
$ |
— |
|
|
|
— |
|
|
$ |
— |
|
|
|
— |
|
|
$ |
8,417 |
|
|
|
11.70 |
% |
|
$ |
— |
|
|
|
— |
|
|
$ |
8,417 |
|
|
|
11.70 |
% |
62
Liabilities
Total liabilities were $4.424 billion as of December 31, 2019, compared to $3.923 billion at December 31, 2018, an increase of $501 million, the components of which are discussed below.
Deposits
Our total deposits were $3.790 billion as of December 31, 2019, compared to $3.450 billion as of December 31, 2018, an increase of $339.6 million. Deposits grew during the year as a result of the execution of our strategy to focus on total customer relationships to attract deposits from existing lending customers. We experienced growth in our certificates of deposit as these higher cost deposit products were used to fund our growth during the year. We also experienced growth in our non-interest bearing demand deposits during the year. As of December 31, 2019, interest bearing demand deposits, noninterest bearing deposits, money market deposits and savings deposits accounted for 59% of our total deposits, while individual retirement accounts, certificates of deposit, and brokered deposits made up 41% of total deposits. See Note 10 – Deposits in the accompanying notes to consolidated financial statements included elsewhere in this report for details of our deposit balances as of December 31, 2019 and 2018.
The following table summarizes our average deposit balances and weighted average rates:
|
|
|
Year Ended December 31, 2019 |
|
|
Year Ended December 31, 2018 |
|
|
Year Ended December 31, 2017 |
|
|||||||||||||||||||||||||||
|
|
|
Average |
|
|
Average |
|
|
% of |
|
|
Average |
|
|
Average |
|
|
% of |
|
|
Average |
|
|
Average |
|
|
% of |
|
|||||||||
|
(Dollars in thousands) |
|
Balance |
|
|
Rates |
|
|
Total |
|
|
Balance |
|
|
Rates |
|
|
Total |
|
|
Balance |
|
|
Rates |
|
|
Total |
|
|||||||||
|
Interest bearing demand |
|
$ |
593,178 |
|
|
|
0.25 |
% |
|
|
17 |
% |
|
$ |
451,327 |
|
|
|
0.23 |
% |
|
|
16 |
% |
|
$ |
331,023 |
|
|
|
0.16 |
% |
|
|
16 |
% |
|
Individual retirement accounts |
|
|
110,553 |
|
|
|
1.57 |
% |
|
|
3 |
% |
|
|
108,170 |
|
|
|
1.25 |
% |
|
|
4 |
% |
|
|
100,731 |
|
|
|
1.21 |
% |
|
|
5 |
% |
|
Money market |
|
|
433,922 |
|
|
|
1.33 |
% |
|
|
12 |
% |
|
|
318,927 |
|
|
|
0.82 |
% |
|
|
11 |
% |
|
|
209,229 |
|
|
|
0.24 |
% |
|
|
10 |
% |
|
Savings |
|
|
363,760 |
|
|
|
0.13 |
% |
|
|
10 |
% |
|
|
281,995 |
|
|
|
0.10 |
% |
|
|
10 |
% |
|
|
175,821 |
|
|
|
0.06 |
% |
|
|
8 |
% |
|
Certificates of deposit |
|
|
1,016,797 |
|
|
|
2.22 |
% |
|
|
28 |
% |
|
|
809,321 |
|
|
|
1.48 |
% |
|
|
28 |
% |
|
|
782,384 |
|
|
|
1.19 |
% |
|
|
37 |
% |
|
Brokered deposits |
|
|
348,523 |
|
|
|
2.34 |
% |
|
|
10 |
% |
|
|
291,776 |
|
|
|
1.99 |
% |
|
|
10 |
% |
|
|
87,395 |
|
|
|
1.59 |
% |
|
|
4 |
% |
|
Total interest bearing deposits |
|
|
2,866,733 |
|
|
|
1.40 |
% |
|
|
80 |
% |
|
|
2,261,516 |
|
|
|
1.02 |
% |
|
|
79 |
% |
|
|
1,686,583 |
|
|
|
0.78 |
% |
|
|
80 |
% |
|
Noninterest bearing demand |
|
|
723,682 |
|
|
— |
|
|
|
20 |
% |
|
|
605,863 |
|
|
— |
|
|
|
21 |
% |
|
|
408,729 |
|
|
— |
|
|
|
20 |
% |
|||
|
Total deposits |
|
$ |
3,590,415 |
|
|
|
1.12 |
% |
|
|
100 |
% |
|
$ |
2,867,379 |
|
|
|
0.80 |
% |
|
|
100 |
% |
|
$ |
2,095,312 |
|
|
|
0.62 |
% |
|
|
100 |
% |
The following table provides information on the maturity distribution of time deposits with individual balances of $100,000 to $250,000 and of time deposits with individual balances of $250,000 or more as of December 31, 2019:
|
|
|
$100,000 to |
|
|
Over |
|
|
|
|
|
||
|
(Dollars in thousands) |
|
$250,000 |
|
|
$250,000 |
|
|
Total |
|
|||
|
Maturity |
|
|
|
|
|
|
|
|
|
|
|
|
|
3 months or less |
|
$ |
83,370 |
|
|
$ |
28,356 |
|
|
$ |
111,726 |
|
|
Over 3 through 6 months |
|
|
159,223 |
|
|
|
80,535 |
|
|
|
239,758 |
|
|
Over 6 through 12 months |
|
|
215,368 |
|
|
|
83,636 |
|
|
|
299,004 |
|
|
Over 12 months |
|
|
122,111 |
|
|
|
60,002 |
|
|
|
182,113 |
|
|
|
|
$ |
580,072 |
|
|
$ |
252,529 |
|
|
$ |
832,601 |
|
Other Borrowings
Customer Repurchase Agreements
The following table provides a summary of our customer repurchase agreements as of and for the years ended December 31, 2019, 2018, and 2017:
|
|
|
December 31, |
|
|
December 31, |
|
|
December 31, |
|
|||
|
(Dollars in thousands) |
|
2019 |
|
|
2018 |
|
|
2017 |
|
|||
|
Amount outstanding at end of the year |
|
$ |
2,033 |
|
|
$ |
4,485 |
|
|
$ |
11,488 |
|
|
Weighted average interest rate at end of the year |
|
|
0.03 |
% |
|
|
0.01 |
% |
|
|
0.02 |
% |
|
Average daily balance during the year |
|
$ |
7,823 |
|
|
$ |
8,648 |
|
|
$ |
12,906 |
|
|
Weighted average interest rate during the year |
|
|
0.02 |
% |
|
|
0.02 |
% |
|
|
0.02 |
% |
|
Maximum month-end balance during the year |
|
$ |
14,463 |
|
|
$ |
13,844 |
|
|
$ |
21,041 |
|
63
Our customer repurchase agreements generally have overnight maturities. Variances in these balances are attributable to normal customer behavior and seasonal factors affecting their liquidity positions
FHLB Advances
As part of our overall funding and liquidity management program, from time to time we borrow from the Federal Home Loan Bank. The following table provides a summary of our FHLB borrowings as of and for the years ended December 31, 2019, 2018, and 2017:
|
|
|
December 31, |
|
|
December 31, |
|
|
December 31, |
|
|||
|
(Dollars in thousands) |
|
2019 |
|
|
2018 |
|
|
2017 |
|
|||
|
Amount outstanding at end of the year |
|
$ |
430,000 |
|
|
$ |
330,000 |
|
|
$ |
365,000 |
|
|
Weighted average interest rate at end of the year |
|
|
1.58 |
% |
|
|
2.52 |
% |
|
|
1.39 |
% |
|
Average daily balance during the year |
|
$ |
369,548 |
|
|
$ |
345,388 |
|
|
$ |
300,451 |
|
|
Weighted average interest rate during the year |
|
|
2.32 |
% |
|
|
1.96 |
% |
|
|
1.05 |
% |
|
Maximum month-end balance during the year |
|
$ |
530,000 |
|
|
$ |
455,000 |
|
|
$ |
385,000 |
|
Our FHLB advances are collateralized by assets, including a blanket pledge of certain loans. Of the FHLB borrowings outstanding as of December 31, 2019, $400.0 million were short term borrowings maturing within one year and $30.0 million were long term borrowings maturing after five years. As of December 31, 2019 and 2018, we had $871.0 million and $516.4 million, respectively, in unused and available advances from the FHLB. The increase in our total borrowing capacity from December 31, 2018 to December 31, 2019 was primarily the result of our growth in assets and loans held for investment.
Subordinated Notes
On September 30, 2016, we issued $50.0 million of Fixed-to-Floating Rate Subordinated Notes due 2026 (the “2016 Notes”). The 2016 Notes initially bear interest at 6.50% per annum, are payable semi-annually in arrears, to, but excluding, September 30, 2021, and, thereafter and to, but excluding, the maturity date or earlier redemption, interest shall be payable quarterly in arrears, at an annual floating rate equal to three-month LIBOR as determined for the applicable quarterly period, plus 5.345%. We may, at our option, beginning on September 30, 2021 and on any scheduled interest payment date thereafter, redeem the 2016 Notes, in whole or in part, at a redemption price equal to 100% of the principal amount of the 2016 Notes to be redeemed plus accrued and unpaid interest to, but excluding, the date of redemption.
On November 27, 2019, we issued $39.5 million of Fixed-to-Floating Rate Subordinated Notes due 2029 (the “2019 Notes”). The 2019 Notes initially bear interest at 4.875% per annum, payable semi-annually in arrears, to, but excluding, November 27, 2024, and, thereafter and to, but excluding, the maturity date or earlier redemption, interest shall be payable quarterly in arrears, at an annual floating rate equal to a benchmark rate, initially three-month LIBOR, as determined for the applicable quarterly period, plus 3.330%. We may, at our option, beginning on November 27, 2024 and on any scheduled interest payment date thereafter, redeem the 2019 Notes, in whole or in part, at a redemption price equal to the outstanding principal amount of the 2019 Notes to be redeemed plus accrued and unpaid interest to, but excluding, the date of redemption.
The Notes are included on our consolidated balance sheet as liabilities; however, for regulatory purposes, the carrying value of these obligations is eligible for inclusion in Tier 2 regulatory capital.
Issuance costs related to the 2016 Notes and the 2019 Notes totaled $1.3 million and $1.2 million, respectively, and have been netted against the subordinated notes liability on the consolidated balance sheets. The debt issuance costs are being amortized using the effective interest method over the life of the 2016 Notes and the 2019 Notes as a component of interest expense. The carrying value of the 2016 Notes and the 2019 Notes totaled $87.3 million at December 31, 2019.
64
Junior Subordinated Debentures
The following provides a summary of our junior subordinated debentures as of December 31, 2019:
|
|
|
|
|
|
|
|
|
|
|
|
|
Variable |
|
Interest Rate At |
|
|
|
(Dollars in thousands) |
|
Face Value |
|
|
Carrying Value |
|
|
Maturity Date |
|
Interest Rate |
|
December 31, 2019 |
|
|||
|
National Bancshares Capital Trust II |
|
$ |
15,464 |
|
|
$ |
13,094 |
|
|
September 2033 |
|
LIBOR + 3.00% |
|
4.89% |
|
|
|
National Bancshares Capital Trust III |
|
|
17,526 |
|
|
|
12,771 |
|
|
July 2036 |
|
LIBOR + 1.64% |
|
3.63% |
|
|
|
ColoEast Capital Trust I |
|
|
5,155 |
|
|
|
3,543 |
|
|
September 2035 |
|
LIBOR + 1.60% |
|
3.56% |
|
|
|
ColoEast Capital Trust II |
|
|
6,700 |
|
|
|
4,627 |
|
|
March 2037 |
|
LIBOR + 1.79% |
|
3.75% |
|
|
|
Valley Bancorp Statutory Trust I |
|
|
3,093 |
|
|
|
2,867 |
|
|
September 2032 |
|
LIBOR + 3.40% |
|
5.35% |
|
|
|
Valley Bancorp Statutory Trust II |
|
|
3,093 |
|
|
|
2,664 |
|
|
July 2034 |
|
LIBOR + 2.75% |
|
4.65% |
|
|
|
|
|
$ |
51,031 |
|
|
$ |
39,566 |
|
|
|
|
|
|
|
|
|
These debentures are unsecured obligations and were issued to trusts that are unconsolidated subsidiaries. The trusts in turn issued trust preferred securities with identical payment terms to unrelated investors. The debentures may be called by the Company at par plus any accrued but unpaid interest; however, we have no current plans to redeem them prior to maturity. Interest on the debentures is calculated quarterly, based on a rate equal to three month LIBOR plus a weighted average spread of 2.24%. As part of the purchase accounting adjustments made with the National Bancshares, Inc. acquisition on October 15, 2013, the ColoEast acquisition on August 1, 2016, and the Valley acquisition on December 9, 2017, we adjusted the carrying value of the junior subordinated debentures to fair value as of the respective acquisition dates. The discount on the debentures will continue to be amortized through maturity and recognized as a component of interest expense.
The debentures are included on our consolidated balance sheet as liabilities; however, for regulatory purposes, these obligations are eligible for inclusion in regulatory capital, subject to certain limitations. All of the carrying value of $39.6 million was allowed in the calculation of Tier I capital as of December 31, 2019.
Capital Resources and Liquidity Management
Capital Resources
Our stockholders’ equity totaled $636.6 million as of December 31, 2019 and 2018. The increase in total equity from our net income for the year ended December 31, 2019 was offset by common stock repurchased during the period.
Liquidity Management
We define liquidity as our ability to generate sufficient cash to fund current loan demand, deposit withdrawals, or other cash demands and disbursement needs, and otherwise to operate on an ongoing basis.
We manage liquidity at the holding company level as well as that of our bank subsidiary. The management of liquidity at both levels is critical, because the holding company and our bank subsidiary have different funding needs and sources, and each is subject to regulatory guidelines and requirements which require minimum levels of liquidity. We believe that our liquidity ratios meet or exceed those guidelines and our present position is adequate to meet our current and future liquidity needs.
Our liquidity requirements are met primarily through cash flow from operations, receipt of pre-paid and maturing balances in our loan and investment portfolios, debt financing and increases in customer deposits. Our liquidity position is supported by management of liquid assets and liabilities and access to other sources of funds. Liquid assets include cash, interest earning deposits in banks, federal funds sold, securities available for sale and maturing or prepaying balances in our investment and loan portfolios. Liquid liabilities include core deposits, federal funds purchased, securities sold under repurchase agreements and other borrowings. Other sources of funds include the sale of loans, brokered deposits, the issuance of additional collateralized borrowings such as FHLB advances, the issuance of debt securities and the issuance of common securities. For additional information regarding our operating, investing and financing cash flows, see the Consolidated Statements of Cash Flows provided in our consolidated financial statements.
In addition to the liquidity provided by the sources described above, our subsidiary bank maintains correspondent relationships with other banks in order to sell loans or purchase overnight funds should additional liquidity be needed. As of December 31, 2019, TBK Bank had unsecured federal funds lines of credit with seven unaffiliated banks totaling $137.5 million, with no amounts advanced against those lines at that time.
65
Regulatory Capital Requirements
Our capital management consists of providing equity to support our current and future operations. We are subject to various regulatory capital requirements administered by federal and state banking agencies. Failure to meet minimum capital requirements can initiate certain mandatory and possibly additional discretionary actions by regulators that, if undertaken, could have a direct material effect on the Company’s or TBK Bank’s financial statements. For further information regarding our regulatory capital requirements, see Note 18 – Regulatory Matters in the accompanying notes to the consolidated financial statements included elsewhere in this report.
Contractual Obligations
The following table summarizes our contractual obligations and other commitments to make future payments as of December 31, 2019. The amount of the obligations presented in the table reflect principal amounts only and exclude the amount of interest we are obligated to pay. Also excluded from the table are a number of obligations to be settled in cash. These excluded items are reflected in our consolidated balance sheet and include deposits with no stated maturity, trade payables, and accrued interest payable.
|
|
|
Payments Due by Period - December 31, 2019 |
|
|||||||||||||||||
|
(Dollars in thousands) |
|
Total |
|
|
Less Than 1 Year |
|
|
1 – 3 Years |
|
|
4 – 5 Years |
|
|
After 5 Years |
|
|||||
|
Customer repurchase agreements |
|
$ |
2,033 |
|
|
$ |
2,033 |
|
|
$ |
— |
|
|
$ |
— |
|
|
$ |
— |
|
|
ICC contingent consideration |
|
|
22,000 |
|
|
|
22,000 |
|
|
|
— |
|
|
|
— |
|
|
|
— |
|
|
FHLB advances |
|
|
430,000 |
|
|
|
400,000 |
|
|
|
— |
|
|
|
— |
|
|
|
30,000 |
|
|
Subordinated notes |
|
|
89,500 |
|
|
|
— |
|
|
|
— |
|
|
|
— |
|
|
|
89,500 |
|
|
Junior subordinated debentures |
|
|
51,031 |
|
|
|
— |
|
|
|
— |
|
|
|
— |
|
|
|
51,031 |
|
|
Operating lease agreements |
|
|
23,563 |
|
|
|
4,036 |
|
|
|
7,705 |
|
|
|
6,078 |
|
|
|
5,744 |
|
|
Time deposits with stated maturity dates |
|
|
1,539,512 |
|
|
|
1,245,273 |
|
|
|
282,098 |
|
|
|
12,141 |
|
|
|
— |
|
|
Total contractual obligations |
|
$ |
2,157,639 |
|
|
$ |
1,673,342 |
|
|
$ |
289,803 |
|
|
$ |
18,219 |
|
|
$ |
176,275 |
|
Off-Balance Sheet Arrangements
In the normal course of business, we enter into various transactions, which, in accordance with GAAP, are not included in our consolidated balance sheets. We enter into these transactions to meet the financing needs of our customers. These transactions include commitments to extend credit and standby and commercial letters of credit, which involve, to varying degrees, elements of credit risk and interest rate risk in excess of the amounts recognized in the consolidated balance sheets. For further information, see Note 15 – Off-Balance Sheet Loan Commitments in the accompanying notes to the consolidated financial statements included elsewhere in this report.
Critical Accounting Policies and Estimates
Certain of our accounting estimates are important to the portrayal of our financial condition, since they require management to make difficult, complex or subjective judgments, some of which may relate to matters that are inherently uncertain. Estimates are susceptible to material changes as a result of changes in facts and circumstances. Facts and circumstances which could affect these judgments include, but are not limited to, changes in interest rates, changes in the performance of the economy and changes in the financial condition of borrowers. Management believes that determining the allowance for loan and lease losses is its most critical accounting estimate. Our accounting policies are discussed in detail in Note 1 – Summary of Significant Accounting Policies in the accompanying notes to the consolidated financial statements included elsewhere in this report.
66
Allowance for Loan and Lease Loss. Management considers the policies related to the allowance for loan and lease losses as the most critical to the financial statement presentation. The total allowance for loan and lease losses includes activity related to allowances calculated in accordance with Accounting Standards Codification (“ASC”) 310, Receivables, and ASC 450, Contingencies. The allowance for loan and lease losses is established through a provision for loan losses charged to current earnings. The amount maintained in the allowance reflects management’s estimate of incurred losses in the loan portfolio at the balance sheet date. The allowance for loan and lease losses is comprised of specific reserves assigned to certain impaired loans and general reserves. Factors contributing to the determination of specific reserves include the creditworthiness of the borrower, and more specifically, changes in the expected future receipt of principal and interest payments and/or in the value of pledged collateral. A reserve is recorded when the carrying amount of the loan exceeds the discounted estimated cash flows using the loan’s initial effective interest rate or the fair value of the collateral for certain collateral dependent loans. For purposes of establishing the general reserve, we stratify the loan portfolio into homogeneous groups of loans that possess similar loss potential characteristics and apply a loss ratio to these groups of loans to estimate the credit losses in the loan portfolio. We use both historical loss ratios and qualitative loss factors assigned to major loan collateral types to establish general component loss allocations. Refer to “Allowance for Loan and Lease Losses” above and Note 1 – Summary of Significant Accounting Policies in the accompanying notes to the consolidated financial statements elsewhere in this report for further discussion of the risk factors considered by management in establishing the allowance for loan and lease loss.
Adoption of New Accounting Standards
In June 2016, the FASB issued ASU 2016-13, “Financial Instruments – Credit Losses (Topic 326): Measurement of Credit Losses on Financial Instruments” (“ASU 2016-13”). ASU 2016-13 makes significant changes to the accounting for credit losses on financial instruments presented on an amortized cost basis and disclosures about them. The new current expected credit loss (CECL) impairment model will require an estimate of expected credit losses, measured over the contractual life of an instrument, which considers reasonable and supportable forecasts of future economic conditions in addition to information about past events and current conditions. The standard provides significant flexibility and requires a high degree of judgment with regards to pooling financial assets with similar risk characteristics and adjusting the relevant historical loss information in order to develop an estimate of expected lifetime losses. In addition, ASU 2016-13 amends the accounting for credit losses on debt securities and purchased financial assets with credit deterioration. The amendments in ASU 2016-13 are effective for fiscal years beginning after December 31, 2019, and interim periods within those years SEC filers that are not smaller reporting companies. The Company will adopt ASU 2016-13 on January 1, 2020 using the modified retrospective approach. ASU 2016-13 permits the use of estimation techniques that are practical and relevant to the Company’s circumstances, as long as they are applied consistently over time and faithfully estimate expected credit losses in accordance with the standard. The ASU lists several common credit loss methods that are acceptable such as a discounted cash flow (DCF) method, loss-rate method and roll-rate method.
The Company has developed new expected credit loss estimation models. Depending on the nature of each identified pool of financial assets with similar risk characteristics, the Company will implement a DCF method or a loss-rate method to estimate expected credit losses. Incorporating reasonable and supportable forecasts of economic conditions into the estimate of expected credit losses will require significant judgment, such as selecting economic variables and forecast scenarios as well as determining the appropriate length of the forecast horizon. Management will estimate credit losses over a forecast horizon and revert to long term historical loss experience on a straight line basis. Management will select economic variables it believes to be most relevant based on the composition of the loan portfolio, likely to include forecasted levels of employment, retail sales, gross domestic product, and home price index, depending on the nature of the loan segment. Management currently intends to leverage economic projections from a reputable and independent third party to inform its reasonable and supportable forecasts over the one-year forecast period. Other internal and external indicators of economic forecasts will also be considered by management when developing the forecast metrics.
Based on our funded loan portfolio and our outstanding commitments to lend at the adoption date and management’s expectation of future economic conditions at that time, the balances of the allowance for credit losses and the reserve for off balance sheet lending commitments are expected to increase approximately $300,000 and $1,600,000, respectively, upon adoption of ASU 2016-13. More specifically, the allowance for credit losses is expected to increase slightly for the real estate lending portfolios given their longer contractual maturities relative to the loan portfolio as a whole. The commercial and industrial portfolios and the factored receivables portfolio make up the majority of the loan portfolio and consist of loans and lending arrangements with relatively short contractual maturities that are expected to result in a slight reduction to the allowance for credit losses. This expected impact at adoption also includes certain qualitative adjustments to the allowance for credit losses.
Based upon the nature and characteristics of our securities portfolios (including issuer specific matters) at the adoption date, the macroeconomic conditions and forecasts at that date, and other management judgments, management does not currently expect to record any allowance for credit losses on available for sale securities and expects that the allowance for credit losses on held to maturity securities will be approximately $100,000 upon adoption of ASU 2016-13.
As a result of the aforementioned expected adjustments and net of the impact to corresponding deferred tax assets, management expects a reduction of retained earnings of approximately $1,500,000 upon adoption of ASU 2016-13.
67
See Note 1 – Summary of Significant Accounting Policies in the accompanying notes to the consolidated financial statements included elsewhere in this report for further details of recently issued accounting pronouncements and their expected impact on our consolidated financial statements.
ITEM 7A. QUANTITATIVE AND QUALITATIVE DISCLOSURES ABOUT MARKET RISK.
Asset/Liability Management and Interest Rate Risk
The principal objective of our asset and liability management function is to evaluate the interest rate risk within the balance sheet and pursue a controlled assumption of interest rate risk while maximizing net income and preserving adequate levels of liquidity and capital. The Board of Directors of our subsidiary bank has oversight of our asset and liability management function, which is managed by our Chief Financial Officer. Our Chief Financial Officer meets with our senior executive management team regularly to review, among other things, the sensitivity of our assets and liabilities to market interest rate changes, local and national market conditions and market interest rates. That group also reviews our liquidity, capital, deposit mix, loan mix and investment positions.
As a financial institution, our primary component of market risk is interest rate volatility. Fluctuations in interest rates will ultimately impact both the level of income and expense recorded on most of our assets and liabilities, and the fair value of all interest earning assets and interest bearing liabilities, other than those which have a short term to maturity. Interest rate risk is the potential of economic losses due to future interest rate changes. These economic losses can be reflected as a loss of future net interest income and/or a loss of current fair values.
We manage our exposure to interest rates primarily by structuring our balance sheet in the ordinary course of business. We do not typically enter into derivative contracts for the purpose of managing interest rate risk, but we may elect to do so in the future. Based upon the nature of our operations, we are not subject to material foreign exchange risk. We do not own any trading assets.
We use an interest rate risk simulation model to test the interest rate sensitivity of net interest income and the balance sheet. Instantaneous parallel rate shift scenarios are modeled and utilized to evaluate risk and establish exposure limits for acceptable changes in projected net interest margin. These scenarios, known as rate shocks, simulate an instantaneous change in interest rates and use various assumptions, including, but not limited to, prepayments on loans and securities, deposit decay rates, pricing decisions on loans and deposits, reinvestment and replacement of asset and liability cash flows. We also analyze the economic value of equity as a secondary measure of interest rate risk. This is a complementary measure to net interest income where the calculated value is the result of the fair value of assets less the fair value of liabilities. The economic value of equity is a longer term view of interest rate risk because it measures the present value of all future cash flows. The impact of changes in interest rates on this calculation is analyzed for the risk to our future earnings and is used in conjunction with the analyses on net interest income.
The following table summarizes simulated change in net interest income versus unchanged rates:
|
|
|
December 31, 2019 |
|
|
December 31, 2018 |
|
||||||||||
|
|
|
Following 12 Months |
|
|
Months 13-24 |
|
|
Following 12 Months |
|
|
Months 13-24 |
|
||||
|
+400 basis points |
|
|
12.5 |
% |
|
|
9.3 |
% |
|
|
6.8 |
% |
|
|
4.7 |
% |
|
+300 basis points |
|
|
9.4 |
% |
|
|
7.1 |
% |
|
|
5.0 |
% |
|
|
3.4 |
% |
|
+200 basis points |
|
|
6.3 |
% |
|
|
4.9 |
% |
|
|
3.2 |
% |
|
|
2.2 |
% |
|
+100 basis points |
|
|
3.1 |
% |
|
|
2.6 |
% |
|
|
1.4 |
% |
|
|
0.9 |
% |
|
Flat rates |
|
|
0.0 |
% |
|
|
0.0 |
% |
|
|
0.0 |
% |
|
|
0.0 |
% |
|
-100 basis points |
|
|
(3.3 |
%) |
|
|
(2.9 |
%) |
|
|
(2.4 |
%) |
|
|
(2.1 |
%) |
The following table presents the change in our economic value of equity, assuming immediate parallel shifts in interest rates:
|
|
|
Economic Value of Equity at Risk (%) |
|
|||||
|
|
|
December 31, 2019 |
|
|
December 31, 2018 |
|
||
|
+400 basis points |
|
|
22.4 |
% |
|
|
10.6 |
% |
|
+300 basis points |
|
|
18.1 |
% |
|
|
9.8 |
% |
|
+200 basis points |
|
|
13.4 |
% |
|
|
8.2 |
% |
|
+100 basis points |
|
|
7.5 |
% |
|
|
3.7 |
% |
|
Flat rates |
|
|
0.0 |
% |
|
|
0.0 |
% |
|
-100 basis points |
|
|
(9.9 |
%) |
|
|
(5.2 |
%) |
68
Many assumptions are used to calculate the impact of interest rate fluctuations. Actual results may be significantly different than our projections due to several factors, including the timing and frequency of rate changes, market conditions and the shape of the yield curve. The computations of interest rate risk shown above do not include actions that our management may undertake to manage the risks in response to anticipated changes in interest rates, and actual results may also differ due to any actions taken in response to the changing rates.
As part of our asset/liability management strategy, our management has emphasized the origination of shorter duration loans as well as variable rate loans to limit the negative exposure to a rate increase. We also desire to acquire deposit transaction accounts, particularly noninterest or low interest bearing non-maturity deposit accounts, whose cost is less sensitive to changes in interest rates.
69
ITEM 8. FINANCIAL STATEMENTS AND SUPPLEMENTARY DATA.
Report of Independent Registered Public Accounting Firm
Stockholders and the Board of Directors of Triumph Bancorp, Inc.
Dallas, Texas
Opinions on the Financial Statements and Internal Control over Financial Reporting
We have audited the accompanying consolidated balance sheets of Triumph Bancorp, Inc, (the "Company") as of December 31, 2019 and 2018, the related consolidated statements of income, comprehensive income, changes in stockholders’ equity, and cash flows for each of the years in the three-year period ended December 31, 2019, and the related notes (collectively referred to as the "financial statements"). We also have audited the Company’s internal control over financial reporting as of December 31, 2019, based on criteria established in Internal Control – Integrated Framework: (2013) issued by the Committee of Sponsoring Organizations of the Treadway Commission (COSO).
In our opinion, the financial statements referred to above present fairly, in all material respects, the financial position of the Company as of December 31, 2019 and 2018, and the results of its operations and its cash flows for each of the years in the three-year period ended December 31, 2019 in conformity with accounting principles generally accepted in the United States of America. Also in our opinion, the Company maintained, in all material respects, effective internal control over financial reporting as of December 31, 2019, based on criteria established in Internal Control – Integrated Framework: (2013) issued by COSO.
Basis for Opinions
The Company’s management is responsible for these financial statements, for maintaining effective internal control over financial reporting, and for its assessment of the effectiveness of internal control over financial reporting, included in the accompanying Report on Management’s Assessment of Internal Control Over Financial Reporting. Our responsibility is to express an opinion on the Company’s financial statements and an opinion on the Company’s internal control over financial reporting based on our audits. We are a public accounting firm registered with the Public Company Accounting Oversight Board (United States) ("PCAOB") and are required to be independent with respect to the Company in accordance with the U.S. federal securities laws and the applicable rules and regulations of the Securities and Exchange Commission and the PCAOB.
We conducted our audits in accordance with the standards of the PCAOB. Those standards require that we plan and perform the audits to obtain reasonable assurance about whether the financial statements are free of material misstatement, whether due to error or fraud, and whether effective internal control over financial reporting was maintained in all material respects.
Our audits of the financial statements included performing procedures to assess the risks of material misstatement of the financial statements, whether due to error or fraud, and performing procedures that respond to those risks. Such procedures included examining, on a test basis, evidence regarding the amounts and disclosures in the financial statements. Our audits also included evaluating the accounting principles used and significant estimates made by management, as well as evaluating the overall presentation of the financial statements. Our audit of internal control over financial reporting included obtaining an understanding of internal control over financial reporting, assessing the risk that a material weakness exists, and testing and evaluating the design and operating effectiveness of internal control based on the assessed risk. Our audits also included performing such other procedures as we considered necessary in the circumstances. We believe that our audits provide a reasonable basis for our opinions.
Definition and Limitations of Internal Control Over Financial Reporting
A company’s internal control over financial reporting is a process designed to provide reasonable assurance regarding the reliability of financial reporting and the preparation of financial statements for external purposes in accordance with generally accepted accounting principles. A company’s internal control over financial reporting includes those policies and procedures that (1) pertain to the maintenance of records that, in reasonable detail, accurately and fairly reflect the transactions and dispositions of the assets of the company; (2) provide reasonable assurance that transactions are recorded as necessary to permit preparation of financial statements in accordance with generally accepted accounting principles, and that receipts and expenditures of the company are being made only in accordance with authorizations of management and directors of the company; and (3) provide reasonable assurance regarding prevention or timely detection of unauthorized acquisition, use, or disposition of the company’s assets that could have a material effect on the financial statements.
70
Because of its inherent limitations, internal control over financial reporting may not prevent or detect misstatements. Also, projections of any evaluation of effectiveness to future periods are subject to the risk that controls may become inadequate because of changes in conditions, or that the degree of compliance with the policies or procedures may deteriorate.
Critical Audit Matter
The critical audit matter communicated below is a matter arising from the current period audit of the consolidated financial statements that was communicated or required to be communicated to the audit committee and that: (1) relates to accounts or disclosures that are material to the consolidated financial statements and (2) involved our especially challenging, subjective, or complex judgments. The communication of critical audit matters does not alter in any way our opinion on the consolidated financial statements, taken as a whole, and we are not, by communicating the critical audit matter below, providing a separate opinion on the critical audit matter or on the accounts or disclosures to which it relates.
Allowance for Loan and Lease Losses – Qualitative Loss Factors
As described in Notes 1 and 4 to the consolidated financial statements, the Company’s allowance for loan and lease losses (“ALLL”) is a valuation allowance maintained to cover incurred credit losses in the loan portfolio at each balance sheet date. The ALLL was $29,100,000 at December 31, 2019 and consisted primarily of 1) a specific component totaling $5,100,000 of loss allocations on loans individually evaluated for impairment and 2) a general component totaling $24,000,000 of loss allocations on loans collectively evaluated for impairment.
Loss allocations within the general component are based on both historical loss ratios and qualitative loss factors, applied to each loan portfolio category. Qualitative loss factors are based on management’s judgment of how company, market, industry or business specific data and external economic indicators, which are not yet reflected in the historical loss ratios, could impact the Company’s loan portfolios. In determining qualitative loss factors, management considers credit quality factors such as the underlying composition of loan portfolios, credit quality and trends related to delinquency, non-performing and adversely rated loans, and external economic factors and data specific to the Company’s market area and lending portfolios.
The determination of these qualitative loss factors for each loan portfolio category can have a significant impact on the estimate of incurred losses recorded within the general component of the ALLL. The determination of these qualitative loss factors is an inherently subjective process as it requires a high degree of judgment by management to make assumptions regarding how credit quality factors, adjusted for external economic factors and other pertinent economic data, could impact the level of estimated incurred losses within the Company’s loan portfolios.
Given the significance of qualitative loss factors to the overall ALLL, as well as the level of judgment and subjectivity involved in management’s determination of the qualitative loss factors, we have identified auditing the qualitative loss factors used to establish the general component of the ALLL to be a critical audit matter because it required especially subjective auditor judgment.
The primary audit procedures we performed in response to this critical audit matter included:
|
|
• |
Tested management’s review controls over the determination of qualitative loss factor adjustments. |
|
|
• |
Tested internal controls over the completeness and accuracy of the data used in qualitative loss factor adjustments, as well as internal controls over the mathematical accuracy of management’s ALLL calculation. |
|
|
• |
Performed substantive testing procedures over management’s and analysis supporting their determination of qualitative loss factor adjustments. |
|
|
• |
Performed substantive procedures over the completeness and accuracy of the data used in qualitative loss factor adjustments and verified the mathematical accuracy of management’s ALLL calculation. |
|
|
• |
Evaluated the period-to-period consistency with which qualitative loss factors are determined and applied. |
|
|
• |
Evaluated the reasonableness of qualitative loss factors used based on our understanding of trends within the Company’s loan portfolio as well as changes in observable and economic indicators. |
/s/ Crowe LLP
We have served as the Company's auditor since 2012.
Dallas, Texas
February 11, 2020
71
TRIUMPH BANCORP, INC. AND SUBSIDIARIES
CONSOLIDATED BALANCE SHEETS
December 31, 2019 and 2018
(Dollar amounts in thousands)
|
|
|
December 31, |
|
|
December 31, |
|
||
|
|
|
2019 |
|
|
2018 |
|
||
|
ASSETS |
|
|
|
|
|
|
|
|
|
Cash and due from banks |
|
$ |
|
|
|
$ |
|
|
|
Interest bearing deposits with other banks |
|
|
|
|
|
|
|
|
|
Total cash and cash equivalents |
|
|
|
|
|
|
|
|
|
Securities - equity investments |
|
|
|
|
|
|
|
|
|
Securities - available for sale |
|
|
|
|
|
|
|
|
|
Securities - held to maturity, fair value $ |
|
|
|
|
|
|
|
|
|
Loans held for sale |
|
|
|
|
|
|
|
|
|
Loans, net of allowance for loan and lease losses of $ |
|
|
|
|
|
|
|
|
|
Federal Home Loan Bank and other restricted stock, at cost |
|
|
|
|
|
|
|
|
|
Premises and equipment, net |
|
|
|
|
|
|
|
|
|
Other real estate owned, net |
|
|
|
|
|
|
|
|
|
Goodwill |
|
|
|
|
|
|
|
|
|
Intangible assets, net |
|
|
|
|
|
|
|
|
|
Bank-owned life insurance |
|
|
|
|
|
|
|
|
|
Deferred tax asset, net |
|
|
|
|
|
|
|
|
|
Other assets |
|
|
|
|
|
|
|
|
|
Total assets |
|
$ |
|
|
|
$ |
|
|
|
LIABILITIES AND STOCKHOLDERS' EQUITY |
|
|
|
|
|
|
|
|
|
Liabilities |
|
|
|
|
|
|
|
|
|
Deposits |
|
|
|
|
|
|
|
|
|
Noninterest bearing |
|
$ |
|
|
|
$ |
|
|
|
Interest bearing |
|
|
|
|
|
|
|
|
|
Total deposits |
|
|
|
|
|
|
|
|
|
Customer repurchase agreements |
|
|
|
|
|
|
|
|
|
Federal Home Loan Bank advances |
|
|
|
|
|
|
|
|
|
Subordinated notes |
|
|
|
|
|
|
|
|
|
Junior subordinated debentures |
|
|
|
|
|
|
|
|
|
Other liabilities |
|
|
|
|
|
|
|
|
|
Total liabilities |
|
|
|
|
|
|
|
|
|
Commitments and contingencies - See Notes 14 and 15 |
|
|
|
|
|
|
|
|
|
Stockholders' equity - See Note 19 |
|
|
|
|
|
|
|
|
|
Common stock, |
|
|
|
|
|
|
|
|
|
Additional paid-in-capital |
|
|
|
|
|
|
|
|
|
Treasury stock, at cost |
|
|
( |
) |
|
|
( |
) |
|
Retained earnings |
|
|
|
|
|
|
|
|
|
Accumulated other comprehensive income (loss) |
|
|
|
|
|
|
( |
) |
|
Total stockholders’ equity |
|
|
|
|
|
|
|
|
|
Total liabilities and stockholders' equity |
|
$ |
|
|
|
$ |
|
|
See accompanying notes to consolidated financial statements.
72
TRIUMPH BANCORP, INC. AND SUBSIDIARIES
CONSOLIDATED STATEMENTS OF INCOME
Years Ended December 31, 2019, 2018 and 2017
(Dollar amounts in thousands, except per share amounts)
|
|
|
2019 |
|
|
2018 |
|
|
2017 |
|
|||
|
Interest and dividend income: |
|
|
|
|
|
|
|
|
|
|
|
|
|
Loans, including fees |
|
$ |
|
|
|
$ |
|
|
|
$ |
|
|
|
Factored receivables, including fees |
|
|
|
|
|
|
|
|
|
|
|
|
|
Securities |
|
|
|
|
|
|
|
|
|
|
|
|
|
FHLB and other restricted stock |
|
|
|
|
|
|
|
|
|
|
|
|
|
Cash deposits |
|
|
|
|
|
|
|
|
|
|
|
|
|
Total interest income |
|
|
|
|
|
|
|
|
|
|
|
|
|
Interest expense: |
|
|
|
|
|
|
|
|
|
|
|
|
|
Deposits |
|
|
|
|
|
|
|
|
|
|
|
|
|
Subordinated notes |
|
|
|
|
|
|
|
|
|
|
|
|
|
Junior subordinated debentures |
|
|
|
|
|
|
|
|
|
|
|
|
|
Other borrowings |
|
|
|
|
|
|
|
|
|
|
|
|
|
Total interest expense |
|
|
|
|
|
|
|
|
|
|
|
|
|
Net interest income |
|
|
|
|
|
|
|
|
|
|
|
|
|
Provision for loan losses |
|
|
|
|
|
|
|
|
|
|
|
|
|
Net interest income after provision for loan losses |
|
|
|
|
|
|
|
|
|
|
|
|
|
Noninterest income: |
|
|
|
|
|
|
|
|
|
|
|
|
|
Service charges on deposits |
|
|
|
|
|
|
|
|
|
|
|
|
|
Card income |
|
|
|
|
|
|
|
|
|
|
|
|
|
Net OREO gains (losses) and valuation adjustments |
|
|
|
|
|
|
( |
) |
|
|
( |
) |
|
Net gains (losses) on sale of securities |
|
|
|
|
|
|
( |
) |
|
|
|
|
|
Fee income |
|
|
|
|
|
|
|
|
|
|
|
|
|
Insurance commissions |
|
|
|
|
|
|
|
|
|
|
|
|
|
Gain on sale of subsidiary or division |
|
|
— |
|
|
|
|
|
|
|
|
|
|
Asset management fees |
|
|
— |
|
|
|
— |
|
|
|
|
|
|
Other |
|
|
|
|
|
|
|
|
|
|
|
|
|
Total noninterest income |
|
|
|
|
|
|
|
|
|
|
|
|
|
Noninterest expense: |
|
|
|
|
|
|
|
|
|
|
|
|
|
Salaries and employee benefits |
|
|
|
|
|
|
|
|
|
|
|
|
|
Occupancy, furniture and equipment |
|
|
|
|
|
|
|
|
|
|
|
|
|
FDIC insurance and other regulatory assessments |
|
|
|
|
|
|
|
|
|
|
|
|
|
Professional fees |
|
|
|
|
|
|
|
|
|
|
|
|
|
Amortization of intangible assets |
|
|
|
|
|
|
|
|
|
|
|
|
|
Advertising and promotion |
|
|
|
|
|
|
|
|
|
|
|
|
|
Communications and technology |
|
|
|
|
|
|
|
|
|
|
|
|
|
Other |
|
|
|
|
|
|
|
|
|
|
|
|
|
Total noninterest expense |
|
|
|
|
|
|
|
|
|
|
|
|
|
Net income before income tax expense |
|
|
|
|
|
|
|
|
|
|
|
|
|
Income tax expense |
|
|
|
|
|
|
|
|
|
|
|
|
|
Net income |
|
|
|
|
|
|
|
|
|
|
|
|
|
Dividends on preferred stock |
|
|
— |
|
|
|
( |
) |
|
|
( |
) |
|
Net income available to common stockholders |
|
$ |
|
|
|
$ |
|
|
|
$ |
|
|
|
Earnings per common share |
|
|
|
|
|
|
|
|
|
|
|
|
|
Basic |
|
$ |
|
|
|
$ |
|
|
|
$ |
|
|
|
Diluted |
|
$ |
|
|
|
$ |
|
|
|
$ |
|
|
See accompanying notes to consolidated financial statements.
73
TRIUMPH BANCORP, INC. AND SUBSIDIARIES
CONSOLIDATED STATEMENTS OF COMPREHENSIVE INCOME
Years Ended December 31, 2019, 2018 and 2017
(Dollar amounts in thousands, except per share amounts)
|
|
|
2019 |
|
|
2018 |
|
|
2017 |
|
|||
|
Net income |
|
$ |
|
|
|
$ |
|
|
|
$ |
|
|
|
Other comprehensive income: |
|
|
|
|
|
|
|
|
|
|
|
|
|
Unrealized gains (losses) on securities available for sale: |
|
|
|
|
|
|
|
|
|
|
|
|
|
Unrealized holding gains (losses) arising during the period |
|
|
|
|
|
|
( |
) |
|
|
( |
) |
|
Reclassification of amount realized through sale of securities |
|
|
( |
) |
|
|
|
|
|
|
( |
) |
|
Tax effect |
|
|
( |
) |
|
|
|
|
|
|
|
|
|
Total other comprehensive income (loss) |
|
|
|
|
|
|
( |
) |
|
|
( |
) |
|
Comprehensive income |
|
$ |
|
|
|
$ |
|
|
|
$ |
|
|
See accompanying notes to consolidated financial statements.
74
TRIUMPH BANCORP, INC. AND SUBSIDIARIES
CONSOLIDATED STATEMENTS OF CHANGES IN STOCKHOLDERS’ EQUITY
Years Ended December 31, 2019, 2018 and 2017
(Dollar amounts in thousands, except per share amounts)
|
|
|
Preferred Stock |
|
|
Common Stock |
|
|
|
|
|
|
Treasury Stock |
|
|
|
|
|
|
Accumulated |
|
|
|
|
|
||||||||||||
|
|
|
Liquidation |
|
|
|
|
|
|
|
|
|
|
Additional |
|
|
|
|
|
|
|
|
|
|
|
|
|
|
Other |
|
|
Total |
|
||||
|
|
|
Preference |
|
|
Shares |
|
|
Par |
|
|
Paid-in- |
|
|
Shares |
|
|
|
|
|
|
Retained |
|
|
Comprehensive |
|
|
Stockholders' |
|
||||||||
|
|
|
Amount |
|
|
Outstanding |
|
|
Amount |
|
|
Capital |
|
|
Outstanding |
|
|
Cost |
|
|
Earnings |
|
|
Income (Loss) |
|
|
Equity |
|
|||||||||
|
Balance, January 1, 2017 |
|
$ |
|
|
|
|
|
|
|
$ |
|
|
|
$ |
|
|
|
|
|
|
|
$ |
( |
) |
|
$ |
|
|
|
$ |
( |
) |
|
$ |
|
|
|
Issuance of common stock, net of issuance costs |
|
|
— |
|
|
|
|
|
|
|
|
|
|
|
|
|
|
|
— |
|
|
|
— |
|
|
|
— |
|
|
|
— |
|
|
|
|
|
|
Issuance of restricted stock awards |
|
|
— |
|
|
|
|
|
|
|
— |
|
|
|
— |
|
|
|
— |
|
|
|
— |
|
|
|
— |
|
|
|
— |
|
|
|
— |
|
|
Stock based compensation |
|
|
— |
|
|
|
— |
|
|
|
— |
|
|
|
|
|
|
|
— |
|
|
|
— |
|
|
|
— |
|
|
|
— |
|
|
|
|
|
|
Forfeiture of restricted stock awards |
|
|
— |
|
|
|
( |
) |
|
|
— |
|
|
|
|
|
|
|
|
|
|
|
( |
) |
|
|
— |
|
|
|
— |
|
|
|
— |
|
|
Stock option exercises, net |
|
|
— |
|
|
|
|
|
|
|
— |
|
|
|
|
|
|
|
— |
|
|
|
— |
|
|
|
— |
|
|
|
— |
|
|
|
|
|
|
Warrant exercises, net |
|
|
— |
|
|
|
|
|
|
|
|
|
|
|
( |
) |
|
|
— |
|
|
|
— |
|
|
|
— |
|
|
|
— |
|
|
|
— |
|
|
Purchase of treasury stock |
|
|
— |
|
|
|
( |
) |
|
|
— |
|
|
|
— |
|
|
|
|
|
|
|
( |
) |
|
|
— |
|
|
|
— |
|
|
|
( |
) |
|
Preferred stock converted to common stock |
|
|
( |
) |
|
|
|
|
|
|
— |
|
|
|
|
|
|
|
— |
|
|
|
— |
|
|
|
— |
|
|
|
— |
|
|
|
— |
|
|
Series A Preferred dividends |
|
|
— |
|
|
|
— |
|
|
|
— |
|
|
|
— |
|
|
|
— |
|
|
|
— |
|
|
|
( |
) |
|
|
— |
|
|
|
( |
) |
|
Series B Preferred dividends |
|
|
— |
|
|
|
— |
|
|
|
— |
|
|
|
— |
|
|
|
— |
|
|
|
— |
|
|
|
( |
) |
|
|
— |
|
|
|
( |
) |
|
Net income |
|
|
— |
|
|
|
— |
|
|
|
— |
|
|
|
— |
|
|
|
— |
|
|
|
— |
|
|
|
|
|
|
|
— |
|
|
|
|
|
|
Other comprehensive income (loss) |
|
|
— |
|
|
|
— |
|
|
|
— |
|
|
|
— |
|
|
|
— |
|
|
|
— |
|
|
|
— |
|
|
|
( |
) |
|
|
( |
) |
|
Balance, December 31, 2017 |
|
$ |
|
|
|
|
|
|
|
$ |
|
|
|
$ |
|
|
|
|
|
|
|
$ |
( |
) |
|
$ |
|
|
|
$ |
( |
) |
|
$ |
|
|
|
Issuance of common stock, net of issuance costs |
|
|
— |
|
|
|
|
|
|
|
|
|
|
|
|
|
|
|
— |
|
|
|
— |
|
|
|
— |
|
|
|
— |
|
|
|
|
|
|
Issuance of restricted stock awards |
|
|
— |
|
|
|
|
|
|
|
|
|
|
|
( |
) |
|
|
— |
|
|
|
— |
|
|
|
— |
|
|
|
— |
|
|
|
— |
|
|
Stock based compensation |
|
|
— |
|
|
|
— |
|
|
|
— |
|
|
|
|
|
|
|
— |
|
|
|
— |
|
|
|
— |
|
|
|
— |
|
|
|
|
|
|
Forfeiture of restricted stock awards |
|
|
— |
|
|
|
( |
) |
|
|
— |
|
|
|
|
|
|
|
|
|
|
|
( |
) |
|
|
— |
|
|
|
— |
|
|
|
— |
|
|
Stock option exercises, net |
|
|
— |
|
|
|
|
|
|
|
— |
|
|
|
( |
) |
|
|
— |
|
|
|
— |
|
|
|
— |
|
|
|
— |
|
|
|
( |
) |
|
Purchase of treasury stock |
|
|
— |
|
|
|
( |
) |
|
|
— |
|
|
|
— |
|
|
|
|
|
|
|
( |
) |
|
|
— |
|
|
|
— |
|
|
|
( |
) |
|
Preferred stock converted to common stock |
|
|
( |
) |
|
|
|
|
|
|
|
|
|
|
|
|
|
|
— |
|
|
|
— |
|
|
|
— |
|
|
|
— |
|
|
|
— |
|
|
Series A Preferred dividends |
|
|
— |
|
|
|
— |
|
|
|
— |
|
|
|
— |
|
|
|
— |
|
|
|
— |
|
|
|
( |
) |
|
|
— |
|
|
|
( |
) |
|
Series B Preferred dividends |
|
|
— |
|
|
|
— |
|
|
|
— |
|
|
|
— |
|
|
|
— |
|
|
|
— |
|
|
|
( |
) |
|
|
— |
|
|
|
( |
) |
|
Net income |
|
|
— |
|
|
|
— |
|
|
|
— |
|
|
|
— |
|
|
|
— |
|
|
|
— |
|
|
|
|
|
|
|
— |
|
|
|
|
|
|
Other comprehensive income (loss) |
|
|
— |
|
|
|
— |
|
|
|
— |
|
|
|
— |
|
|
|
— |
|
|
|
— |
|
|
|
— |
|
|
|
( |
) |
|
|
( |
) |
|
Balance, December 31, 2018 |
|
$ |
— |
|
|
|
|
|
|
$ |
|
|
|
$ |
|
|
|
|
|
|
|
$ |
( |
) |
|
$ |
|
|
|
$ |
( |
) |
|
$ |
|
|
|
Issuance of restricted stock awards |
|
|
— |
|
|
|
|
|
|
|
|
|
|
|
( |
) |
|
|
— |
|
|
|
— |
|
|
|
— |
|
|
|
— |
|
|
|
— |
|
|
Stock based compensation |
|
|
— |
|
|
|
— |
|
|
|
— |
|
|
|
|
|
|
|
— |
|
|
|
— |
|
|
|
— |
|
|
|
— |
|
|
|
|
|
|
Forfeiture of restricted stock awards |
|
|
— |
|
|
|
( |
) |
|
|
— |
|
|
|
|
|
|
|
|
|
|
|
( |
) |
|
|
— |
|
|
|
— |
|
|
|
— |
|
|
Stock option exercises, net |
|
|
— |
|
|
|
|
|
|
|
— |
|
|
|
— |
|
|
|
— |
|
|
|
— |
|
|
|
— |
|
|
|
— |
|
|
|
— |
|
|
Purchase of treasury stock |
|
|
— |
|
|
|
( |
) |
|
|
— |
|
|
|
— |
|
|
|
|
|
|
|
( |
) |
|
|
— |
|
|
|
— |
|
|
|
( |
) |
|
Net income |
|
|
— |
|
|
|
— |
|
|
|
— |
|
|
|
— |
|
|
|
— |
|
|
|
— |
|
|
|
|
|
|
|
— |
|
|
|
|
|
|
Other comprehensive income (loss) |
|
|
— |
|
|
|
— |
|
|
|
— |
|
|
|
— |
|
|
|
— |
|
|
|
— |
|
|
|
— |
|
|
|
|
|
|
|
|
|
|
Balance, December 31, 2019 |
|
$ |
— |
|
|
|
|
|
|
$ |
|
|
|
$ |
|
|
|
|
|
|
|
$ |
( |
) |
|
$ |
|
|
|
$ |
|
|
|
$ |
|
|
See accompanying notes to consolidated financial statements.
75
TRIUMPH BANCORP, INC. AND SUBSIDIARIES
CONSOLIDATED STATEMENTS OF CASH FLOWS
Years Ended December 31, 2019, 2018 and 2017
(Dollar amounts in thousands, except per share amounts)
|
|
|
2019 |
|
|
2018 |
|
|
2017 |
|
|||
|
Cash flows from operating activities: |
|
|
|
|
|
|
|
|
|
|
|
|
|
Net income |
|
$ |
|
|
|
$ |
|
|
|
$ |
|
|
|
Adjustments to reconcile net income to net cash provided by (used in) operating activities: |
|
|
|
|
|
|
|
|
|
|
|
|
|
Depreciation |
|
|
|
|
|
|
|
|
|
|
|
|
|
Net accretion on loans |
|
|
( |
) |
|
|
( |
) |
|
|
( |
) |
|
Amortization of subordinated notes issuance costs |
|
|
|
|
|
|
|
|
|
|
|
|
|
Amortization of junior subordinated debentures |
|
|
|
|
|
|
|
|
|
|
|
|
|
Net amortization on securities |
|
|
|
|
|
|
|
|
|
|
|
|
|
Amortization of intangible assets |
|
|
|
|
|
|
|
|
|
|
|
|
|
Deferred taxes |
|
|
|
|
|
|
|
|
|
|
|
|
|
Provision for loan losses |
|
|
|
|
|
|
|
|
|
|
|
|
|
Stock based compensation |
|
|
|
|
|
|
|
|
|
|
|
|
|
Net (gains) losses on sale of securities |
|
|
( |
) |
|
|
|
|
|
|
( |
) |
|
Net (gains) losses on equity securities |
|
|
( |
) |
|
|
— |
|
|
|
— |
|
|
Origination of loans held for sale |
|
|
( |
) |
|
|
( |
) |
|
|
— |
|
|
Purchases of loans held for sale |
|
|
( |
) |
|
|
— |
|
|
|
— |
|
|
Proceeds from sale of loans originated for sale |
|
|
|
|
|
|
|
|
|
|
— |
|
|
Net gains on sale of loans |
|
|
( |
) |
|
|
( |
) |
|
|
— |
|
|
Net (gains) losses on loans transferred to loans held for sale |
|
|
( |
) |
|
|
— |
|
|
|
|
|
|
Net OREO (gains) losses and valuation adjustments |
|
|
( |
) |
|
|
|
|
|
|
|
|
|
Net change in operating leases |
|
|
|
|
|
|
— |
|
|
|
— |
|
|
Income from CLO warehouse investments |
|
|
— |
|
|
|
— |
|
|
|
( |
) |
|
Gain on sale of subsidiary or division |
|
|
— |
|
|
|
( |
) |
|
|
( |
) |
|
(Increase) decrease in other assets |
|
|
( |
) |
|
|
( |
) |
|
|
|
|
|
Increase (decrease) in other liabilities |
|
|
|
|
|
|
|
|
|
|
|
|
|
Net cash provided by (used in) operating activities |
|
|
|
|
|
|
|
|
|
|
|
|
|
Cash flows from investing activities: |
|
|
|
|
|
|
|
|
|
|
|
|
|
Purchases of equity securities |
|
|
— |
|
|
|
— |
|
|
|
( |
) |
|
Purchases of securities available for sale |
|
|
( |
) |
|
|
( |
) |
|
|
( |
) |
|
Proceeds from sales of securities available for sale |
|
|
|
|
|
|
|
|
|
|
|
|
|
Proceeds from maturities, calls, and pay downs of securities available for sale |
|
|
|
|
|
|
|
|
|
|
|
|
|
Purchases of securities held to maturity |
|
|
— |
|
|
|
— |
|
|
|
( |
) |
|
Proceeds from maturities, calls, and pay downs of securities held to maturity |
|
|
|
|
|
|
|
|
|
|
|
|
|
Purchases of loans held for investment |
|
|
( |
) |
|
|
— |
|
|
|
— |
|
|
Proceeds from sale of loans |
|
|
|
|
|
|
|
|
|
|
|
|
|
Net change in loans |
|
|
( |
) |
|
|
( |
) |
|
|
( |
) |
|
Purchases of premises and equipment, net |
|
|
( |
) |
|
|
( |
) |
|
|
( |
) |
|
Net proceeds from sale of OREO |
|
|
|
|
|
|
|
|
|
|
|
|
|
Proceeds from surrender of BOLI |
|
|
— |
|
|
|
|
|
|
|
— |
|
|
Net cash paid for CLO warehouse investments |
|
|
— |
|
|
|
— |
|
|
|
( |
) |
|
Net proceeds from CLO warehouse investments |
|
|
— |
|
|
|
— |
|
|
|
|
|
|
(Purchases) redemptions of FHLB and other restricted stock, net |
|
|
( |
) |
|
|
|
|
|
|
( |
) |
|
Cash paid for acquisitions, net of cash acquired |
|
|
— |
|
|
|
( |
) |
|
|
|
|
|
Proceeds from sale of subsidiary or division, net |
|
|
— |
|
|
|
|
|
|
|
|
|
|
Net cash provided by (used in) investing activities |
|
|
( |
) |
|
|
( |
) |
|
|
( |
) |
|
Cash flows from financing activities: |
|
|
|
|
|
|
|
|
|
|
|
|
|
Net increase (decrease) in deposits |
|
|
|
|
|
|
|
|
|
|
|
|
|
Increase (decrease) in customer repurchase agreements |
|
|
( |
) |
|
|
( |
) |
|
|
|
|
|
Increase (decrease) in Federal Home Loan Bank advances |
|
|
|
|
|
|
( |
) |
|
|
|
|
|
Proceeds from issuance of subordinated notes, net |
|
|
|
|
|
|
— |
|
|
|
— |
|
|
Issuance of common stock, net of issuance costs |
|
|
— |
|
|
|
|
|
|
|
|
|
|
Stock option exercises |
|
|
— |
|
|
|
( |
) |
|
|
|
|
|
Purchase of treasury stock |
|
|
( |
) |
|
|
( |
) |
|
|
( |
) |
|
Dividends on preferred stock |
|
|
— |
|
|
|
( |
) |
|
|
( |
) |
|
Net cash provided by (used in) financing activities |
|
|
|
|
|
|
|
|
|
|
|
|
|
Net increase (decrease) in cash and cash equivalents |
|
|
( |
) |
|
|
|
|
|
|
|
|
|
Cash and cash equivalents at beginning of period |
|
|
|
|
|
|
|
|
|
|
|
|
|
Cash and cash equivalents at end of period |
|
$ |
|
|
|
$ |
|
|
|
$ |
|
|
See accompanying notes to consolidated financial statements.
76
TRIUMPH BANCORP, INC. AND SUBSIDIARIES
CONSOLIDATED STATEMENTS OF CASH FLOWS
Years Ended December 31, 2019, 2018 and 2017
(Dollar amounts in thousands, except per share amounts)
|
|
|
2019 |
|
|
2018 |
|
|
2017 |
|
|||
|
Supplemental cash flow information: |
|
|
|
|
|
|
|
|
|
|
|
|
|
Interest paid |
|
$ |
|
|
|
$ |
|
|
|
$ |
|
|
|
Income taxes paid, net |
|
$ |
|
|
|
$ |
|
|
|
$ |
|
|
|
Cash paid for operating lease liabilities (See Note 1) |
|
$ |
|
|
|
$ |
— |
|
|
$ |
— |
|
|
Supplemental noncash disclosures: |
|
|
|
|
|
|
|
|
|
|
|
|
|
Loans transferred to OREO |
|
$ |
|
|
|
$ |
|
|
|
$ |
|
|
|
Premises transferred to OREO |
|
$ |
— |
|
|
$ |
|
|
|
$ |
|
|
|
Loans transferred to loans held for sale |
|
$ |
|
|
|
$ |
|
|
|
$ |
|
|
|
Consideration received from sale of subsidiary or division |
|
$ |
— |
|
|
$ |
— |
|
|
$ |
|
|
|
Assets transferred to assets held for sale |
|
$ |
— |
|
|
$ |
— |
|
|
$ |
|
|
|
Lease liabilities arising from obtaining right-of-use assets (See Note 1) |
|
$ |
|
|
|
$ |
— |
|
|
$ |
— |
|
See accompanying notes to consolidated financial statements.
77
TRIUMPH BANCORP, INC. AND SUBSIDIARIES
NOTES TO CONSOLIDATED FINANCIAL STATEMENTS
NOTE 1 — SUMMARY OF SIGNIFICANT ACCOUNTING POLICIES
Nature of Operations
Triumph Bancorp, Inc. (collectively with its subsidiaries, “Triumph”, or the “Company” as applicable) is a financial holding company headquartered in Dallas, Texas. The accompanying consolidated financial statements include the accounts of the Company and its wholly owned subsidiaries Triumph CRA Holdings, LLC (“TCRA”), TBK Bank, SSB (“TBK Bank”), TBK Bank’s wholly owned factoring subsidiary Advance Business Capital LLC, which currently operates under the d/b/a of Triumph Business Capital (“TBC”), and TBK Bank’s wholly owned subsidiary Triumph Insurance Group, Inc. (“TIG”).
On March 16, 2018, the Company sold the assets of Triumph Healthcare Finance (“THF”) and exited its healthcare asset based lending line of business. THF operated within the Company’s TBK Bank subsidiary.
On March 31, 2017 the Company sold its membership interest in its wholly owned subsidiary Triumph Capital Advisors, LLC (“TCA”).
See Note 2 – Business Combinations and Divestitures for additional information pertaining to the THF and TCA sales and the impact of the transactions on the Company’s consolidated financial statements.
Principles of Consolidation and Basis of Presentation
The Company consolidates subsidiaries in which it holds, directly or indirectly, a controlling financial interest. The Company determines whether it has a controlling financial interest in an entity by first evaluating whether the entity is a voting interest entity or a variable interest entity under U.S. generally accepted accounting principles (“GAAP”). Voting interest entities are entities in which the total equity investment at risk is sufficient to enable the entity to finance itself independently and provides the equity holders with the obligation to absorb losses, the right to receive residual returns and the right to make decisions about the entity’s activities. The Company consolidates voting interest entities in which it has at least a majority of the voting interest. Variable interest entities (“VIEs”) are entities that lack one or more of the characteristics of a voting interest entity. A controlling financial interest in a VIE is present when an enterprise has both the power to direct the activities of the VIE that most significantly impact the VIE’s economic performance and an obligation to absorb losses or the right to receive benefits that could potentially be significant to the VIE. The enterprise with a controlling financial interest, known as the primary beneficiary, consolidates the VIE.
In consolidation, all significant intercompany accounts and transactions are eliminated. Investments in unconsolidated entities are accounted for using the equity method of accounting when the Company has the ability to exercise significant influence over operating and financing decisions. Investments that do not meet the criteria for equity method accounting are accounted for using the cost method of accounting.
The accounting and reporting policies of the Company and its subsidiaries conform to GAAP and general practice within the banking industry. Certain reclassifications have been made to prior year amounts to conform to the current year presentation. The Company uses the accrual basis of accounting for financial reporting purposes.
Use of Estimates
To prepare financial statements in conformity with GAAP management makes estimates and assumptions based on available information. These estimates and assumptions affect the amounts reported in the financial statements and the disclosures provided, and actual results could differ.
Cash and Cash Equivalents
For the purposes of reporting cash flows, cash and cash equivalents include cash on hand, amounts due from banks, other short term investments and federal funds sold. All highly liquid investments with an initial maturity of less than
78
TRIUMPH BANCORP, INC. AND SUBSIDIARIES
NOTES TO CONSOLIDATED FINANCIAL STATEMENTS
Debt Securities
The Company determines the classification of debt securities at the time of purchase. Debt securities that management has the positive intent and ability to hold to maturity are classified as held to maturity and recorded at amortized cost. Trading securities are recorded at fair value with changes in fair value included in earnings. Debt securities not classified as held to maturity or trading are classified as available for sale and recorded at fair value, with unrealized gains and losses excluded from earnings and reported in other comprehensive income (loss), net of tax.
Gains and losses on the sale of securities are recorded on the trade date and are determined using the specific-identification method. Amortization of premiums and discounts are recognized in interest income over the period to maturity using the interest method.
Management evaluates securities for other-than-temporary impairment (“OTTI”) on a quarterly basis, and more frequently when economic or market conditions warrant such an evaluation. For securities in an unrealized loss position, management considers the extent and duration of the unrealized loss, and the financial condition and near-term prospects of the issuer. Management also assesses whether it intends to sell, or it is more likely than not that it will be required to sell, a security in an unrealized loss position before recovery of its amortized cost basis. In analyzing an issuer’s financial condition, the Company may consider whether the securities are issued by the federal government or its agencies, whether downgrades by bond rating agencies have occurred, and the results of reviews of the issuers’ financial condition. The Company conducts regular reviews of the bond agency ratings of securities and considers whether the securities were issued by or have principal and interest payments guaranteed by the federal government or its agencies. These reviews focus on the underlying rating of the issuer and also include the insurance rating of securities that have an insurance component or guarantee. The ratings and financial condition of the issuers are monitored, as well as the financial condition and ratings of the insurers and guarantors.
If either of the criteria regarding intent or requirement to sell is met, the entire difference between amortized cost and fair value is recognized as impairment through earnings. For debt securities that do not meet the aforementioned criteria, the amount of impairment is split into two components as follows: 1) OTTI related to credit loss, which must be recognized through earnings, and 2) OTTI related to other factors, which is recognized in other comprehensive income. The credit loss is defined as the difference between the present value of the cash flows expected to be collected and the amortized cost basis. For equity securities, the entire amount of impairment is recognized through earnings.
Equity Securities
Equity securities are recorded at fair value, with unrealized gains and losses included in earnings beginning January 1, 2018 after adoption of Accounting Standards Update No. 2016-01, “Financial Instruments – Overall: Recognition and Measurement of Financial Assets and Financial Liabilities.” Prior to January 1, 2018, unrealized gains and losses on equity securities were excluded from earnings and reported in other comprehensive income (loss), net of tax. Gains and losses on the sale of securities are recorded on the trade date and are determined using the specific-identification method.
Loans Held for Sale
The Company elects the fair value option for recording 1-4 family residential mortgage loans and commercial loans held for sale in accordance with Accounting Standards Codification (“ASC”) 825, “Financial Instruments”. The fair value of loans held for sale is determined based on outstanding commitments from investors to purchase such loans or prevailing market rates. Increases or decreases in the fair value of loans held for sale, if any, are charged to earnings and are recorded in noninterest income in the consolidated statements of income. Gains and losses on sales of loans are based on the difference between the final selling price and the carrying value of the related loan sold.
Mortgage loans held for sale are generally sold with servicing rights released.
Management occasionally transfers loans held for investment to loans held for sale. Gains or losses on the transfer of loans to loans held for sale are recorded in noninterest income in the consolidated statements of income.
Loans
Loans that management has the intent and ability to hold for the foreseeable future or until maturity or payoff are reported at the unpaid principal balance outstanding, net of unearned income, deferred loan fees and costs, and any direct principal charge-offs. Interest income is accrued on the unpaid principal balance. Loan origination fees, net of certain direct origination costs, are deferred and recognized in interest income over the remaining life of the loan without anticipating prepayments.
79
TRIUMPH BANCORP, INC. AND SUBSIDIARIES
NOTES TO CONSOLIDATED FINANCIAL STATEMENTS
Loans are considered past due or delinquent when the contractual principal or interest due in accordance with the terms of the loan agreement or any portion thereof remains unpaid after the due date of the scheduled payment. Loans are classified as nonaccrual when, in the opinion of management, collection of principal or interest is doubtful. The accrual of interest income on loans is typically discontinued at the time the loan is
Acquired Loans
Acquired loans are recorded at fair value at the date of acquisition with no initial valuation allowance based on a discounted cash flow methodology that considers various factors including the type of loan and related collateral, classification status, fixed or variable interest rate, term of loan and whether or not the loan was amortizing, and a discount rate reflecting the Company’s assessment of risk inherent in the cash flow estimates. Certain larger purchased loans are individually evaluated while certain purchased loans are grouped together according to similar risk characteristics and are treated in the aggregate when applying various valuation techniques. These cash flow evaluations are inherently subjective as they require material estimates, all of which may be susceptible to significant change.
Loans acquired in a business combination that have evidence of deterioration of credit quality since origination and for which it is probable, at acquisition, that the Company will be unable to collect all contractually required payments receivable are considered purchased credit impaired (“PCI”). PCI loans are individually evaluated and recorded at fair value at the date of acquisition with no initial valuation allowance based on a discounted cash flow methodology that considers various factors including the type of loan and related collateral, classification status, fixed or variable interest rate, term of loan and whether or not the loan was amortizing, and a discount rate reflecting the Company’s assessment of risk inherent in the cash flow estimates. The difference between the undiscounted cash flows expected at acquisition and the investment in the loan, or the “accretable yield,” is recognized as interest income on a level-yield method over the life of the loan. Contractually required payments for interest and principal that exceed the undiscounted cash flows expected at acquisition, or the “nonaccretable difference,” are not recognized on the balance sheet and do not result in any yield adjustments, loss accruals or valuation allowances. Increases in expected cash flows, including prepayments, subsequent to the initial investment are recognized prospectively through adjustment of the yield on the loan over its remaining life. Decreases in expected cash flows are recognized as impairment. Valuation allowances on PCI loans reflect only losses incurred after the acquisition (meaning the present value of all cash flows expected at acquisition that ultimately are not to be received).
For acquired loans not deemed credit-impaired at acquisition, the differences between the initial fair value and the unpaid principal balance are recognized as interest income on a level-yield basis over the lives of the related loans. Subsequent to the acquisition date, methods utilized to estimate the required allowance for loan and lease losses for these loans is similar to originated loans; however, a provision for credit losses will be recorded only to the extent the required allowance exceeds any remaining purchase discounts. Once an acquired loan undergoes new underwriting and meets the criteria for a new loan, such as in the case of a loan renewal, any remaining fair value adjustments are accreted into interest income and the loan establishes a new amortized cost basis that is fully subject to the Company's allowance for loan and lease loss methodology.
Factored Receivables
The Company purchases invoices from its factoring clients in schedules or batches. Cash is advanced to the client to the extent of the applicable advance rate, less fees, as set forth in the individual factoring agreements. The face value of the invoices purchased are recorded by the Company as factored receivables, and the unadvanced portions of the invoices purchased, less fees, are considered client reserves. The client reserves are held to settle any payment disputes or collection shortfalls, may be used to pay clients’ obligations to various third parties as directed by the client, are periodically released to or withdrawn by clients, and are reported as deposits.
Unearned factoring fees and unearned net origination fees are deferred and recognized over the weighted average collection period for each client. Subsequent factoring fees are recognized in interest income as incurred by the client and deducted from the clients’ reserve balances.
Other factoring-related fees, which include wire transfer fees, carrier payment fees, fuel advance fees, and other similar fees, are reported by the Company as non-interest income as incurred by the client.
80
TRIUMPH BANCORP, INC. AND SUBSIDIARIES
NOTES TO CONSOLIDATED FINANCIAL STATEMENTS
Loan Commitments and Related Financial Instruments
Financial instruments include off-balance sheet credit instruments, such as commitments to make loans and commercial letters of credit, issued to meet customer financing needs. The face amount for these items represents the exposure to loss, before considering customer collateral or ability to repay. Such financial instruments are recorded when they are funded.
Allowance for Loan and Lease Losses
The allowance for loan and lease losses (the “ALLL”) is a valuation allowance maintained to cover incurred losses that are estimated in accordance with US GAAP. It is our estimate of credit losses inherent in our loan portfolio at each balance sheet date. Our methodology for analyzing the allowance for loan and lease losses consists of general and specific components. For the general component, we stratify the loan portfolio into homogeneous groups of loans that possess similar loss potential characteristics and apply a loss ratio to these groups of loans to estimate the credit losses in the loan portfolio. We use both historical loss ratios and qualitative loss factors assigned to major loan collateral types to establish general component loss allocations. Qualitative loss factors are based on management's judgment of company, market, industry or business specific data and external economic indicators, which are not yet reflected in the historical loss ratios, and that could impact the Company's loan portfolios. Management sets and adjusts qualitative loss factors by regularly reviewing changes in underlying loan composition of specific portfolios. Management also considers credit quality and trends relating to delinquency, non-performing and adversely rated loans within the Company's loan portfolio when evaluating qualitative loss factors. Additionally, management adjusts qualitative factors to account for the potential impact of external economic factors and other pertinent economic data specific to our primary market area and lending portfolios.
For the specific component, the allowance for loan and lease losses includes loans where management has concerns about the borrower's ability to repay and on individually analyzed loans found to be impaired. Management evaluates current information and events regarding a borrower's ability to repay its obligations and considers a loan to be impaired when the ultimate collectability of amounts due, according to the contractual terms of the loan agreement, is in doubt. Loans that experience insignificant payment delays and payment shortfalls generally are not classified as impaired. Management determines the significance of payment delays and payment shortfalls on a case-by-case basis, taking into consideration all of the circumstances surrounding the loan and the borrower, including the length of the delay, the reasons for the delay, the borrower’s prior payment record, and the amount of the shortfall in relation to the principal and interest owed. If an impaired loan is collateral-dependent, the fair value of the collateral, less the estimated cost to sell, is used to determine the amount of impairment. If an impaired loan is not collateral-dependent, the impairment amount is determined using the negative difference, if any, between the estimated discounted cash flows and the loan amount due. For impaired loans, the amount of the impairment can be adjusted, based on current data, until such time as the actual basis is established by acquisition of the collateral or until the basis is collected. Impairment losses are reflected in the allowance for loan and lease losses through a charge to the provision for credit losses. Subsequent recoveries are credited to the allowance for loan and lease losses. Cash receipts for accruing loans are applied to principal and interest under the contractual terms of the loan agreement. Cash receipts on impaired loans for which the accrual of interest has been discontinued are applied first to principal.
Loan losses are charged against the ALLL when management believes the uncollectability of a loan balance is confirmed. Subsequent recoveries, if any, are credited to the ALLL. Allocations of the ALLL may be made for specific loans, but the entire allowance is available for any loan that, in management’s judgment, should be charged-off. Large groups of smaller balance homogeneous loans are collectively evaluated for impairment, and accordingly, they are not separately identified for impairment disclosures. The Company considers these loans to be homogeneous in nature due to the smaller dollar amount and the similar underwriting criteria.
PCI loans are not considered impaired on the acquisition date. For PCI loans, a decline in the present value of current expected cash flows compared to the previously estimated expected cash flows, due in any part to change in credit, is considered an impairment event and a provision for loan losses will be recorded during the period as necessary.
A loan that has been modified or renewed is considered a troubled debt restructuring (“TDR”) when two conditions are met: 1) the borrower is experiencing financial difficulty and 2) concessions are made for the borrower's benefit that would not otherwise be considered for a borrower or transaction with similar credit risk characteristics. TDRs are separately identified for impairment and are measured at the present value of estimated future cash flows using the loan’s effective rate at inception. If a TDR is considered to be a collateral dependent loan, the loan is reported, net, at the fair value of the collateral up to the carrying amount of the loan. For TDRs that subsequently default, the Company determines the amount of reserve in accordance with the accounting policy for the ALLL.
81
TRIUMPH BANCORP, INC. AND SUBSIDIARIES
NOTES TO CONSOLIDATED FINANCIAL STATEMENTS
The following loan portfolio categories have been identified for purposes of determining the general component of the ALLL:
Commercial Real Estate — This category of loans consists of the following loan types:
Non-farm Non-residential — This category includes real estate loans for a variety of commercial property types and purposes, including owner occupied commercial real estate loans primarily secured by commercial office or industrial buildings, warehouses or retail buildings where the owner of the building occupies the property. Repayment terms vary considerably, interest rates are fixed or variable, and are structured for full, partial, or no amortization of principal. This category also includes investment real estate loans that are primarily secured by office and industrial buildings, warehouses, small retail shopping centers and various special purpose properties. Generally, these types of loans are thought to involve a greater degree of credit risk than owner occupied commercial real estate as they are more sensitive to adverse economic conditions.
Multi-family residential — Investment real estate loans are primarily secured by non-owner occupied apartment or multifamily residential buildings. Generally, these types of loans are thought to involve a greater degree of credit risk than owner occupied commercial real estate as they are more sensitive to adverse economic conditions.
Construction, land development, land —This category of loans consists of loans to finance the ground up construction, improvement and/or carrying for sale after the completion of construction of owner occupied and non-owner occupied residential and commercial properties, and loans secured by raw or improved land. The repayment of construction loans is generally dependent upon the successful completion of the improvements by the builder for the end user, or sale of the property to a third party. Repayment of land secured loans are dependent upon the successful development and sale of the property, the sale of the land as is, or the outside cash flow of the owners to support the retirement of the debt.
1-4 family residential properties — This category of loans includes both first and junior liens on residential real estate. Home equity revolving lines of credit and home equity term loans are included in this group of loans.
Farmland — These loans are principally loans to purchase farmland.
Commercial — Commercial loans are loans for commercial, corporate and business purposes. The Company’s commercial business loan portfolio is comprised of loans for a variety of purposes and across a variety of industries. These loans include general commercial and industrial loans, loans to purchase capital equipment, agriculture operating loans and other business loans for working capital and operational purposes. Commercial loans are generally secured by accounts receivable, inventory and other business assets. Commercial loans also include shared national credits purchased by the Company.
A portion of the commercial loan portfolio consists of specialty commercial finance products as follows:
Equipment — Equipment finance loans are commercial loans primarily secured by new or used revenue producing, essential-use equipment from major manufacturers that is movable, may be used in more than one type of business, and generally has broad resale markets. Core markets include transportation, construction, and waste. Loan terms do not exceed the economic life of the equipment and typically are
Asset-based Lending — These loans are originated to borrowers to support general working capital needs. The asset-based loan structure involves advances of loan proceeds against a borrowing base which typically consists of accounts receivable, identified readily marketable inventory, or other collateral of the borrower. The maximum amount a customer may borrow at any time is fixed as a percentage of the borrowing base outstanding.
A portion of the commercial loan portfolio also consists of national lending products as follows:
Liquid Credit — Broadly syndicated leveraged loans secured by a variety of collateral types.
Premium Finance — Loans that provide customized premium financing solutions for the acquisition of property and casualty insurance coverage. In effect, these short term premium finance loans allow insureds to pay their insurance premiums over the life of the underlying policy, instead of paying the entire premium at the outset.
82
TRIUMPH BANCORP, INC. AND SUBSIDIARIES
NOTES TO CONSOLIDATED FINANCIAL STATEMENTS
Factored Receivables — The Company operates as a factor by purchasing accounts receivable from its clients, then collecting the receivable from the account debtor. The Company’s smaller factoring relationships are typically structured as “non-recourse” relationships (i.e., the Company retains the credit risk associated with the ability of the account debtor on a purchased invoice to ultimately make payment) and the Company’s larger factoring relationships are typically structured as “recourse” relationships (i.e., the Company’s client agrees to repurchase any invoices for which payment is not ultimately received from the account debtor). Advances initially made to the client to acquire the receivables are typically at a discount to the invoice value. The discount balance is held in client reserves, net of the Company’s compensation. The client reserves are held to settle any payment disputes or collection shortfalls, may be used to pay clients’ obligations to various third parties as directed by the client, are periodically released to or withdrawn by clients, and are reported as deposits.
Consumer — Loans used for personal use typically on an unsecured basis.
Mortgage Warehouse — Mortgage Warehouse facilities are provided to unaffiliated mortgage origination companies and are collateralized by 1-4 family residential loans. The originator closes new mortgage loans with the intent to sell these loans to third party investors for a profit. The Company provides funding to the mortgage companies for the period between the origination and their sale of the loan. The Company has a policy that requires that it separately validate that each residential mortgage loan was underwritten consistent with the underwriting requirements of the final investor or market standards prior to advancing funds. The Company is repaid with the proceeds received from sale of the mortgage loan to the final investor.
Federal Home Loan Bank (“FHLB”) Stock
The Company is a member of the FHLB system. Members of the FHLB are required to own a certain amount of stock based on the level of borrowings and other factors, and may invest in additional amounts. FHLB stock is carried at cost, is restricted as to redemption, and periodically evaluated for impairment based on ultimate recovery of par value. Both cash and stock dividends are reported as income.
Premises and Equipment
Land is carried at cost. Depreciable assets are stated at cost less accumulated depreciation. Leasehold improvements are capitalized and depreciated using the straight-line method over the terms of the respective leases or the estimated useful lives of the improvements, whichever is shorter. Buildings and related components are generally depreciated using the straight-line method with useful lives ranging from thirty to
The Company leases certain properties and equipment under operating leases. For leases in effect upon adoption of Accounting Standards Update 2016-02, “Leases (Topic 842)” at January 1, 2019 and for any leases commencing thereafter, the Company recognizes a liability to make lease payments, the “lease liability”, and an asset representing the right to use the underlying asset during the lease term, the “right-of-use asset”. The lease liability is measured at the present value of the remaining lease payments, discounted at the Company’s incremental borrowing rate. The right-of-use asset is measured at the amount of the lease liability adjusted for the remaining balance of any lease incentives received, any cumulative prepaid or accrued rent if the lease payments are uneven throughout the lease term, any unamortized initial direct costs, and any impairment of the right-of-use-asset. Operating lease expense consists of a single lease cost calculated so that the remaining cost of the lease is allocated over the remaining lease term on a straight-line basis, variable lease payments not included in the lease liability, and any impairment of the right-of-use asset.
Certain of the Company’s leases contain options to renew the lease; however, these renewal options are not included in the calculation of the lease liabilities as they are not reasonably certain to be exercised. The Company’s leases do not contain residual value guarantees or material variable lease payments. The Company does not have any material restrictions or covenants imposed by leases that would impact the Company’s ability to pay dividends or cause the Company to incur additional financial obligations.
The Company has made an accounting policy election to not apply the recognition requirements in Topic 842 to short-term leases. The Company has also elected to use the practical expedient to make an accounting policy election for property leases to include both lease and nonlease components as a single component and account for it as a lease.
The Company’s leases are not complex; therefore there were no significant assumptions or judgements made in applying the requirements of Topic 842, including the determination of whether the contracts contained a lease, the allocation of consideration in the contracts between lease and nonlease components, and the determination of the discount rates for the leases.
83
TRIUMPH BANCORP, INC. AND SUBSIDIARIES
NOTES TO CONSOLIDATED FINANCIAL STATEMENTS
Foreclosed Assets
Assets acquired through loan foreclosure are initially recorded at fair value less costs to sell, establishing a new cost basis. Any write-down in the carrying value of a property at the time of acquisition is charged-off to the allowance for loan and lease losses. After foreclosure, foreclosed assets are carried at the lower of the recorded investment in the asset or the fair value less costs to sell. If fair value declines subsequent to foreclosure, a valuation allowance is recorded through expense. Operating costs after acquisition are expensed.
Goodwill
Goodwill represents the excess of the cost of businesses acquired over the fair value of the net assets acquired. In accordance with ASC 350-20, "Intangibles- Goodwill and Other", the Company evaluates goodwill for impairment on an annual basis or on an interim basis if an event occurs or circumstances change that would more likely than not reduce the fair value below its carrying amount, in accordance with ASC 350-20. The Company’s annual goodwill impairment testing date is October 1.
The Company first assesses qualitative factors to determine whether it is more likely than not that the fair value of a reporting unit is less than its carrying amount as a basis for determining the need to perform the two-step test for goodwill impairment (the qualitative method). If the qualitative method cannot be used or if it determines, based on the qualitative method, that the fair value is more likely than not less than the carrying amount, the Company uses the two-step test. Under the two-step test, the Company compares the estimated fair value of a reporting unit with its carrying amount, including goodwill. If the estimated fair value of a reporting unit exceeds its carrying amount, goodwill of the reporting unit is considered not impaired. If the carrying amount of a reporting unit exceeds its estimated fair value, the second step of the goodwill impairment test is performed to measure the amount of impairment loss, if any. Step two of the goodwill impairment test compares the implied estimated fair value of reporting unit goodwill with the carrying amount of that goodwill. If the carrying amount of goodwill for that reporting unit exceeds the implied fair value of that unit’s goodwill, an impairment loss is recognized in an amount equal to that excess. Our annual goodwill impairment test did
Identifiable Intangible Assets
Intangible assets are acquired assets that lack physical substance but can be distinguished from goodwill because of contractual or other legal rights or because the asset is capable of being sold or exchanged either on its own or in combination with a related contract, asset, or liability. The Company's intangible assets primarily relate to core deposits and customer relationships. Intangible assets with definite useful lives are amortized on an accelerated basis over their estimated life. Intangible assets, premises and equipment and other long-lived assets are tested for impairment whenever events or changes in circumstances indicate the carrying amount of the assets may not be recoverable from future undiscounted cash flows. If impaired, the assets are recorded at fair value with a charge to amortization of intangible assets.
Bank Owned Life Insurance
The Company has purchased life insurance policies on certain key employees. The purchase of these life insurance policies allows the Company to use tax-advantaged rates of return. Bank-owned life insurance is recorded at the amount that can be realized under the insurance contract at the balance sheet date, which is the cash surrender value adjusted for other charges or other amounts due that are probable at settlement.
Income Taxes
The Company files a consolidated tax return with its subsidiaries and is taxed as a C corporation. Deferred tax assets and liabilities are reflected at currently enacted income tax rates applicable to the period in which the deferred tax assets and liabilities are expected to be realized or settled. As changes in tax laws or rates are enacted, deferred tax assets and liabilities are adjusted through the provision for income taxes. Valuation allowances are established when necessary to reduce deferred tax assets to the amount expected to be realized.
A tax position is recognized as a benefit only if it is “more likely than not” that the tax position would be sustained in a tax examination, with a tax examination being presumed to occur. The amount recognized is the largest amount of tax benefit that is greater than
84
TRIUMPH BANCORP, INC. AND SUBSIDIARIES
NOTES TO CONSOLIDATED FINANCIAL STATEMENTS
Fair Values of Financial Instruments
In general, fair values of financial instruments are based upon quoted market prices, where available. If such quoted market prices are not available, fair value is based upon internally developed models that may use, as inputs, observable market-based parameters. Valuation adjustments may be made to ensure that financial instruments are recorded at fair value. These adjustments may include amounts to reflect counterparty credit quality and/or the Company’s creditworthiness, among other things, as well as unobservable parameters. Any such valuation adjustments are applied consistently over time. Changes in assumptions or in market conditions could significantly affect these estimates.
In the ordinary course of business, the Company generally does not sell or transfer non-impaired loans and deposits. As such, the disclosures that present the December 31, 2019 and 2018 estimated fair value for non-impaired loans and deposits are highly judgmental and may not represent amounts to be received if the Company were to sell or transfer such items.
Revenue from Contracts with Customers
The Company records revenue from contracts with customers in accordance with Accounting Standards Codification Topic 606, “Revenue from Contracts with Customers” (“Topic 606”). Under Topic 606, the Company must identify the contract with a customer, identify the performance obligations in the contract, determine the transaction price, allocate the transaction price to the performance obligations in the contract, and recognize revenue when (or as) the Company satisfies a performance obligation. Significant revenue has not been recognized in the current reporting period that results from performance obligations satisfied in previous periods.
The Company’s primary sources of revenue are derived from interest and dividends earned on loans, investment securities, and other financial instruments that are not within the scope of Topic 606. The Company has evaluated the nature of its contracts with customers and determined that further disaggregation of revenue from contracts with customers into more granular categories beyond what is presented in the Consolidated Statements of Income was not necessary. The Company generally fully satisfies its performance obligations on its contracts with customers as services are rendered and the transaction prices are typically fixed; charged either on a periodic basis or based on activity. Because performance obligations are satisfied as services are rendered and the transaction prices are fixed, the Company has made no significant judgments in applying the revenue guidance prescribed in ASC 606 that affect the determination of the amount and timing of revenue from contracts with customers.
Asset Management Fees
On March 31, 2017, the Company sold its membership interests in TCA. At the date of sale, the Company ceased to provide fee based asset management services. Prior to the sale of TCA, asset management fee income was recognized through the Company’s collateralized loan obligation (“CLO”) asset management business operated by TCA and consisted of senior (or base) asset management fees, subordinated management fees, and performance-based incentive fees. Senior and subordinated management fees were based upon a fixed fee rate applied to the amount of outstanding assets being managed by TCA and were accrued by the Company as earned. Performance-based incentive fees were variable in nature and dependent upon the performance of a managed CLO above a prescribed level. The Company did not accrue for performance-based incentive fees that were not finalized until the end of a specified contract period, but recorded such revenues only when final payment was confirmed and related services were completed. The Company did not recognized any revenue that is at risk due to future asset management performance contingencies.
TCA also entered into transactions whereby it earned asset management fee income through the provision of middle and back office services to other CLO asset managers.
Operating Segments
The Company’s reportable segments are comprised of strategic business units primarily based upon industry categories and to a lesser extent, the core competencies relating to product origination, distribution methods, operations and servicing. Segment determination also considered organizational structure and our segment reporting is consistent with the presentation of financial information to the chief operating decision maker to evaluate segment performance, develop strategy, and allocate resources. Our chief operating decision maker is the Chief Executive Officer of Triumph Bancorp, Inc. We have determined our reportable segments are Banking, Factoring, and Corporate.
The banking segment includes the operations of TBK Bank. The banking segment derives its revenue principally from investments in interest earning assets as well as noninterest income typical for the banking industry. The banking segment also includes commercial factoring services which are originated through the commercial finance division of TBK Bank.
85
TRIUMPH BANCORP, INC. AND SUBSIDIARIES
NOTES TO CONSOLIDATED FINANCIAL STATEMENTS
The factoring segment includes the operations of TBC with revenue derived from factoring services.
The corporate segment includes holding company financing and investment activities and management and administrative expenses to support the overall operations of the Company.
On March 31, 2017, the Company sold its
Comprehensive Income (Loss)
Comprehensive income (loss) consists of net income and other comprehensive income (loss). Other comprehensive income includes unrealized gains and losses on debt securities available for sale, net of taxes, which are also recognized as a separate component of equity.
Loss Contingencies
Loss contingencies, including claims and legal actions arising in the ordinary course of business, are recorded as liabilities when the likelihood of loss is probable and an amount or range of loss can be reasonably estimated. Management does not believe such matters exist that will have a material effect on the financial statements.
Transfers of Financial Assets
Transfers of financial assets are accounted for as sales when control over the assets has been relinquished. Control over transferred assets is deemed to be relinquished when (i) the assets have been isolated from the Company, (ii) the transferee has the right (free of conditions that constrain it from taking advantage of that right) to pledge or exchange the transferred assets, and (iii) the Company does not maintain effective control over the transferred assets through either (a) an agreement that entitles and obligates the Company to repurchase or redeem them before their maturity or (b) the ability to unilaterally cause the transferee to return specific assets.
Stock Based Compensation
Compensation cost is recognized for stock based payment awards issued to employees and directors, based on the fair value of these awards at the date of grant. A Black-Scholes model is utilized to estimate the fair value of stock options, a Monte Carlo simulation is utilized to estimate the fair value of market based performance stock units, and the market price of the Company’s common stock at the date of grant is used for restricted stock awards, restricted stock units, and performance based performance stock units. Compensation cost is recognized over the required service period, generally defined as the vesting period. The Company recognizes forfeitures of nonvested awards as they occur.
Earnings Per Common Share
Basic earnings per common share is net income less dividends on preferred stock divided by the weighted average number of common shares outstanding during the period excluding nonvested restricted stock awards. Diluted earnings per common share includes the dilutive effect of additional potential common shares issuable under stock warrants, restricted stock, stock options, and preferred shares that are convertible to common shares.
Advertising Costs
Advertising costs are expensed as incurred.
86
TRIUMPH BANCORP, INC. AND SUBSIDIARIES
NOTES TO CONSOLIDATED FINANCIAL STATEMENTS
Adoption of New Accounting Standards
In February 2016, the Financial Accounting Standards Board (“FASB”) issued Accounting Standards Update (“ASU”) 2016-02, “Leases (Topic 842)” (“ASU 2016-02”). The FASB issued this ASU to increase transparency and comparability among organizations by recognizing lease assets and lease liabilities on the balance sheet by lessees for those leases classified as operating leases under current U.S. GAAP and disclosing key information about leasing arrangements. The new standard was adopted by the Company on January 1, 2019. ASU 2016-02 provides for a modified retrospective transition approach requiring lessees to recognize and measure leases on the balance sheet at the beginning of either the earliest period presented or as of the beginning of the period of adoption. The Company elected to apply ASU 2016-02 as of the beginning of the period of adoption (January 1, 2019) and did not restate comparative periods. Adoption of ASU 2016-02 resulted in the recognition of lease liabilities totaling $
Newly Issued, But Not Yet Effective Accounting Standards
In June 2016, the FASB issued ASU 2016-13, “Financial Instruments – Credit Losses (Topic 326): Measurement of Credit Losses on Financial Instruments” (“ASU 2016-13”). ASU 2016-13 makes significant changes to the accounting for credit losses on financial instruments presented on an amortized cost basis and disclosures about them. The new current expected credit loss (CECL) impairment model will require an estimate of expected credit losses, measured over the contractual life of an instrument, which considers reasonable and supportable forecasts of future economic conditions in addition to information about past events and current conditions. The standard provides significant flexibility and requires a high degree of judgment with regards to pooling financial assets with similar risk characteristics and adjusting the relevant historical loss information in order to develop an estimate of expected lifetime losses. In addition, ASU 2016-13 amends the accounting for credit losses on debt securities and purchased financial assets with credit deterioration. The amendments in ASU 2016-13 are effective for fiscal years beginning after December 31, 2019, and interim periods within those years SEC filers that are not smaller reporting companies. The Company will adopt ASU 2016-13 on January 1, 2020 using the modified retrospective approach. ASU 2016-13 permits the use of estimation techniques that are practical and relevant to the Company’s circumstances, as long as they are applied consistently over time and faithfully estimate expected credit losses in accordance with the standard. The ASU lists several common credit loss methods that are acceptable such as a discounted cash flow (DCF) method, loss-rate method and roll-rate method.
The Company has developed new expected credit loss estimation models. Depending on the nature of each identified pool of financial assets with similar risk characteristics, the Company will implement a DCF method or a loss-rate method to estimate expected credit losses. Incorporating reasonable and supportable forecasts of economic conditions into the estimate of expected credit losses will require significant judgment, such as selecting economic variables and forecast scenarios as well as determining the appropriate length of the forecast horizon. Management will estimate credit losses over a forecast horizon and revert to long term historical loss experience on a straight line basis. Management will select economic variables it believes to be most relevant based on the composition of the loan portfolio, likely to include forecasted levels of employment, retail sales, gross domestic product, and home price index, depending on the nature of the loan segment. Management currently intends to leverage economic projections from a reputable and independent third party to inform its reasonable and supportable forecasts over the forecast period. Other internal and external indicators of economic forecasts will also be considered by management when developing the forecast metrics.
Based on our funded loan portfolio and our outstanding commitments to lend at the adoption date and management’s expectation of future economic conditions at that time, the balances of the allowance for credit losses and the reserve for off balance sheet lending commitments are not expected to materially change upon adoption of ASU 2016-13. More specifically, the allowance for credit losses is expected to increase slightly for the real estate lending portfolios given their longer contractual maturities relative to the loan portfolio as a whole. The commercial and industrial portfolios and the factored receivables portfolio make up the majority of the loan portfolio and consist of loans and lending arrangements with relatively short contractual maturities that are expected to result in a slight reduction to the allowance for credit losses. This expected impact at adoption also includes certain qualitative adjustments to the allowance for credit losses.
Based upon the nature and characteristics of our securities portfolios (including issuer specific matters) at the adoption date, the macroeconomic conditions and forecasts at that date, and other management judgments, management does not currently expect to
87
TRIUMPH BANCORP, INC. AND SUBSIDIARIES
NOTES TO CONSOLIDATED FINANCIAL STATEMENTS
record any allowance for credit losses on available for sale securities and does not expect that the allowance for credit losses on held to maturity securities will be material upon adoption of ASU 2016-13.
As a result of the aforementioned expected adjustments and net of the impact to corresponding deferred tax assets, management does not expect a material adjustment to retained earnings upon adoption of ASU 2016-13.
NOTE 2 — Business combinations AND DIVESTITURES
First Bancorp of Durango, Inc. and Southern Colorado Corp.
Effective September 8, 2018 the Company acquired (i) First Bancorp of Durango, Inc. (“FBD”) and its community banking subsidiaries, The First National Bank of Durango and Bank of New Mexico and (ii) Southern Colorado Corp. (“SCC”) and its community banking subsidiary, Citizens Bank of Pagosa Springs, in all-cash transactions. The acquisitions expanded the Company’s market in Colorado and into New Mexico and further diversified the Company’s loan, customer, and deposit base.
A summary of the estimated fair values of assets acquired, liabilities assumed, consideration transferred, and the resulting goodwill is as follows:
|
(Dollars in thousands) |
|
FBD |
|
|
SCC |
|
|
Total |
|
|||
|
Assets acquired: |
|
|
|
|
|
|
|
|
|
|
|
|
|
Cash and cash equivalents |
|
$ |
|
|
|
$ |
|
|
|
$ |
|
|
|
Securities |
|
|
|
|
|
|
|
|
|
|
|
|
|
Loans held for sale |
|
|
|
|
|
|
— |
|
|
|
|
|
|
Loans |
|
|
|
|
|
|
|
|
|
|
|
|
|
FHLB stock |
|
|
|
|
|
|
|
|
|
|
|
|
|
Premises and equipment |
|
|
|
|
|
|
|
|
|
|
|
|
|
Other real estate owned |
|
|
|
|
|
|
— |
|
|
|
|
|
|
Intangible assets |
|
|
|
|
|
|
|
|
|
|
|
|
|
Other assets |
|
|
|
|
|
|
|
|
|
|
|
|
|
|
|
|
|
|
|
|
|
|
|
|
|
|
|
Liabilities assumed: |
|
|
|
|
|
|
|
|
|
|
|
|
|
Deposits |
|
|
|
|
|
|
|
|
|
|
|
|
|
Federal Home Loan Bank advances |
|
|
|
|
|
|
— |
|
|
|
|
|
|
Other liabilities |
|
|
|
|
|
|
|
|
|
|
|
|
|
|
|
|
|
|
|
|
|
|
|
|
|
|
|
Fair value of net assets acquired |
|
|
|
|
|
|
|
|
|
|
|
|
|
Cash consideration transferred |
|
|
|
|
|
|
|
|
|
|
|
|
|
Goodwill |
|
$ |
|
|
|
$ |
|
|
|
$ |
|
|
The Company has recognized goodwill of $
88
TRIUMPH BANCORP, INC. AND SUBSIDIARIES
NOTES TO CONSOLIDATED FINANCIAL STATEMENTS
In connection with the acquisitions, the Company acquired loans both with and without evidence of credit quality deterioration since origination. The acquired loans were initially recorded at fair value with no carryover of any allowance for loan and lease losses. Acquired loans were segregated between those considered to be purchased credit impaired (“PCI”) loans and those without credit impairment at acquisition. The following table presents details of the estimated fair value of acquired loans at the acquisition date:
|
|
|
Loans Excluding PCI Loans |
|
|
PCI Loans |
|
|
Total Loans |
|
|||||||||||||||||||
|
(Dollars in thousands) |
|
FBD |
|
|
SCC |
|
|
Total |
|
|
FBD |
|
|
SCC |
|
|
Total |
|
|
Acquired |
|
|||||||
|
Commercial real estate |
|
$ |
|
|
|
$ |
|
|
|
$ |
|
|
|
$ |
|
|
|
$ |
|
|
|
$ |
|
|
|
$ |
|
|
|
Construction, land development, land |
|
|
|
|
|
|
|
|
|
|
|
|
|
|
|
|
|
|
— |
|
|
|
|
|
|
|
|
|
|
1-4 family residential properties |
|
|
|
|
|
|
|
|
|
|
|
|
|
|
|
|
|
|
— |
|
|
|
|
|
|
|
|
|
|
Farmland |
|
|
|
|
|
|
|
|
|
|
|
|
|
|
— |
|
|
|
— |
|
|
|
— |
|
|
|
|
|
|
Commercial |
|
|
|
|
|
|
|
|
|
|
|
|
|
|
|
|
|
|
— |
|
|
|
|
|
|
|
|
|
|
Factored receivables |
|
|
— |
|
|
|
— |
|
|
|
— |
|
|
|
— |
|
|
|
— |
|
|
|
— |
|
|
|
— |
|
|
Consumer |
|
|
|
|
|
|
|
|
|
|
|
|
|
|
— |
|
|
|
— |
|
|
|
— |
|
|
|
|
|
|
Mortgage warehouse |
|
|
— |
|
|
|
— |
|
|
|
— |
|
|
|
— |
|
|
|
— |
|
|
|
— |
|
|
|
— |
|
|
|
|
$ |
|
|
|
$ |
|
|
|
$ |
|
|
|
$ |
|
|
|
$ |
|
|
|
$ |
|
|
|
$ |
|
|
The following presents information at the acquisition date for non-PCI loans acquired in the transactions:
|
(Dollars in thousands) |
|
FBD |
|
|
SCC |
|
|
Total |
|
|||
|
Contractually required principal and interest payments |
|
$ |
|
|
|
$ |
|
|
|
$ |
|
|
|
Contractual cash flows not expected to be collected |
|
$ |
|
|
|
$ |
|
|
|
$ |
|
|
|
Fair value at acquisition |
|
$ |
|
|
|
$ |
|
|
|
$ |
|
|
The following presents information at the acquisition date for PCI loans acquired in the transactions:
|
(Dollars in thousands) |
|
FBD |
|
|
SCC |
|
|
Total |
|
|||
|
Contractually required principal and interest payments |
|
$ |
|
|
|
$ |
|
|
|
$ |
|
|
|
Contractual cash flows not expected to be collected (nonaccretable difference) |
|
|
|
|
|
|
|
|
|
|
|
|
|
Expected cash flows at acquisition |
|
|
|
|
|
|
|
|
|
|
|
|
|
Interest component of expected cash flows (accretable yield) |
|
|
|
|
|
|
|
|
|
|
|
|
|
Fair value of loans acquired with deterioration of credit quality |
|
$ |
|
|
|
$ |
|
|
|
$ |
|
|
89
TRIUMPH BANCORP, INC. AND SUBSIDIARIES
NOTES TO CONSOLIDATED FINANCIAL STATEMENTS
The following table presents unaudited supplemental pro forma information for the years ended December 31, 2018 and 2017 as if the FBD and SCC acquisitions had occurred at the beginning of 2017. The supplemental pro forma information includes adjustments for interest income on loans acquired, depreciation expense on property acquired, amortization of intangibles arising from the transactions, and the related income tax effects. Additionally, because FBD and SCC were Subchapter S corporations before the acquisitions and did not incur any federal income tax liabilities, adjustments have been included to estimate the impact of federal income taxes on FBD and SCC’s net income for the periods presented. The supplemental pro forma financial information is not necessarily indicative of the results of operations that would have occurred had the transactions been completed on the assumed date.
|
|
|
Year Ended December 31, 2018 |
|
|||||||||
|
(Dollars in thousands) |
|
FBD |
|
|
SCC |
|
|
Total |
|
|||
|
Net interest income |
|
$ |
|
|
|
$ |
|
|
|
$ |
|
|
|
Noninterest income |
|
$ |
|
|
|
$ |
|
|
|
$ |
|
|
|
Net income |
|
$ |
|
|
|
$ |
|
|
|
$ |
|
|
|
Basic earnings per common share |
|
$ |
|
|
|
$ |
|
|
|
$ |
|
|
|
Diluted earnings per common share |
|
$ |
|
|
|
$ |
|
|
|
$ |
|
|
|
|
|
|
|
|
|
|
|
|
|
|
|
|
|
|
|
Year Ended December 31, 2017 |
|
|||||||||
|
(Dollars in thousands) |
|
FBD |
|
|
SCC |
|
|
Total |
|
|||
|
Net interest income |
|
$ |
|
|
|
$ |
|
|
|
$ |
|
|
|
Noninterest income |
|
$ |
|
|
|
$ |
|
|
|
$ |
|
|
|
Net income |
|
$ |
|
|
|
$ |
|
|
|
$ |
|
|
|
Basic earnings per common share |
|
$ |
|
|
|
$ |
|
|
|
$ |
|
|
|
Diluted earnings per common share |
|
$ |
|
|
|
$ |
|
|
|
$ |
|
|
Revenue and earnings of FBD and SCC since the acquisition date have not been disclosed as the acquired companies were merged into the Company and separate financial information is not readily available.
Expenses related to the acquisitions, including professional fees and other transaction costs, totaling $
Interstate Capital Corporation
On
90
TRIUMPH BANCORP, INC. AND SUBSIDIARIES
NOTES TO CONSOLIDATED FINANCIAL STATEMENTS
A summary of the estimated fair values of assets acquired, liabilities assumed, consideration transferred, and the resulting goodwill is as follows:
|
(Dollars in thousands) |
|
|
|
|
|
Assets acquired: |
|
|
|
|
|
Cash and cash equivalents |
|
$ |
|
|
|
Factored receivables |
|
|
|
|
|
Premises and equipment |
|
|
|
|
|
Intangible assets |
|
|
|
|
|
Other assets |
|
|
|
|
|
|
|
|
|
|
|
Liabilities assumed: |
|
|
|
|
|
Deposits |
|
|
|
|
|
Other liabilities |
|
|
|
|
|
|
|
|
|
|
|
Fair value of net assets acquired |
|
|
|
|
|
Consideration: |
|
|
|
|
|
Cash paid |
|
|
|
|
|
Contingent consideration |
|
|
|
|
|
Total consideration |
|
|
|
|
|
Goodwill |
|
$ |
|
|
ICC’s net assets acquired were allocated to the Company’s Factoring segment whose factoring operations were significantly expanded as a result of the transaction. The Company has recognized goodwill of $
Consideration paid included contingent consideration with an acquisition date fair value of $
Revenue and earnings of ICC since the acquisition date have not been disclosed as the acquired company was merged into the Company and separate financial information is not readily available.
Expenses related to the acquisition, including professional fees and other transaction costs, totaling $
Triumph Healthcare Finance
On
91
TRIUMPH BANCORP, INC. AND SUBSIDIARIES
NOTES TO CONSOLIDATED FINANCIAL STATEMENTS
A summary of the carrying amount of the assets in the Disposal Group and the gain on sale is as follows:
|
(Dollars in thousands) |
|
|
|
|
|
Carrying amount of assets in the disposal group: |
|
|
|
|
|
Loans |
|
$ |
|
|
|
Premises and equipment, net |
|
|
|
|
|
Goodwill |
|
|
|
|
|
Intangible assets, net |
|
|
|
|
|
Other assets |
|
|
|
|
|
Total carrying amount |
|
|
|
|
|
Total consideration received |
|
|
|
|
|
Gain on sale of division |
|
|
|
|
|
Transaction costs |
|
|
|
|
|
Gain on sale of division, net of transaction costs |
|
$ |
|
|
The Disposal Group was included in the Banking segment, and the loans in the Disposal Group were previously included in the commercial loan portfolio.
Valley Bancorp, Inc.
Effective
A summary of the estimated fair values of assets acquired, liabilities assumed, consideration transferred, and the resulting goodwill is as follows:
|
(Dollars in thousands) |
|
|
|
|
|
Assets acquired: |
|
|
|
|
|
Cash and cash equivalents |
|
$ |
|
|
|
Securities |
|
|
|
|
|
Loans |
|
|
|
|
|
FHLB stock |
|
|
|
|
|
Premises and equipment |
|
|
|
|
|
Other real estate owned |
|
|
|
|
|
Intangible assets |
|
|
|
|
|
Bank-owned life insurance |
|
|
|
|
|
Other assets |
|
|
|
|
|
|
|
|
|
|
|
Liabilities assumed: |
|
|
|
|
|
Deposits |
|
|
|
|
|
Junior subordinated debentures |
|
|
|
|
|
Other liabilities |
|
|
|
|
|
|
|
|
|
|
|
Fair value of net assets acquired |
|
|
|
|
|
Consideration transferred |
|
|
|
|
|
Goodwill |
|
$ |
|
|
The Company has recognized goodwill of $
In connection with the acquisition, the Company acquired loans both with and without evidence of credit quality deterioration since origination. The acquired loans were initially recorded at fair value with no carryover of any allowance for loan and lease losses.
92
TRIUMPH BANCORP, INC. AND SUBSIDIARIES
NOTES TO CONSOLIDATED FINANCIAL STATEMENTS
Acquired loans were segregated between those considered to be purchased credit impaired (“PCI”) loans and those without credit impairment at acquisition. The following table presents details of the estimated fair value of acquired loans at the acquisition date:
|
|
|
Loans, |
|
|
|
|
|
|
|
|
|
|
|
|
|
Excluding |
|
|
PCI |
|
|
Total |
|
|||
|
(Dollars in thousands) |
|
PCI Loans |
|
|
Loans |
|
|
Loans |
|
|||
|
Commercial real estate |
|
$ |
|
|
|
$ |
|
|
|
$ |
|
|
|
Construction, land development, land |
|
|
|
|
|
|
|
|
|
|
|
|
|
1-4 family residential properties |
|
|
|
|
|
|
— |
|
|
|
|
|
|
Farmland |
|
|
|
|
|
|
— |
|
|
|
|
|
|
Commercial |
|
|
|
|
|
|
— |
|
|
|
|
|
|
Factored receivables |
|
|
— |
|
|
|
— |
|
|
|
— |
|
|
Consumer |
|
|
|
|
|
|
— |
|
|
|
|
|
|
Mortgage warehouse |
|
|
— |
|
|
|
— |
|
|
|
— |
|
|
|
|
$ |
|
|
|
$ |
|
|
|
$ |
|
|
The following presents information at the acquisition date for non-PCI loans acquired in the transaction:
|
(Dollars in thousands) |
|
|
|
|
|
Contractually required principal and interest payments |
|
$ |
|
|
|
Contractual cash flows not expected to be collected |
|
$ |
|
|
|
Fair value at acquisition |
|
$ |
|
|
The following presents information at the acquisition date for PCI loans acquired in the transaction:
|
(Dollars in thousands) |
|
|
|
|
|
Contractually required principal and interest payments |
|
$ |
|
|
|
Contractual cash flows not expected to be collected (nonaccretable difference) |
|
|
|
|
|
Expected cash flows at acquisition |
|
|
|
|
|
Interest component of expected cash flows (accretable yield) |
|
|
|
|
|
Fair value of loans acquired with deterioration of credit quality |
|
$ |
|
|
Revenue and earnings of Valley since the acquisition date have not been disclosed as the acquired company was merged into the Company and separate financial information is not readily available.
Expenses related to the acquisition, including professional fees and other transaction costs, totaling $
Independent Bank – Colorado Branches
On
93
TRIUMPH BANCORP, INC. AND SUBSIDIARIES
NOTES TO CONSOLIDATED FINANCIAL STATEMENTS
A summary of the estimated fair values of assets acquired, liabilities assumed, consideration transferred, and the resulting goodwill is as follows:
|
(Dollars in thousands) |
|
|
|
|
|
|
Assets acquired: |
|
|
|
|
|
|
Cash and cash equivalents |
|
$ |
|
|
|
|
Loans |
|
|
|
|
|
|
Premises and equipment |
|
|
|
|
|
|
Intangible assets |
|
|
|
|
|
|
Other assets |
|
|
|
|
|
|
|
|
|
|
|
|
|
Liabilities assumed: |
|
|
|
|
|
|
Deposits |
|
|
|
|
|
|
Other liabilities |
|
|
|
|
|
|
|
|
|
|
|
|
|
Fair value of net assets acquired |
|
|
( |
) |
|
|
Cash received from seller, net of $ |
|
|
|
|
|
|
Goodwill |
|
$ |
|
|
The Company has recognized goodwill of $
The loans acquired in the transaction were initially recorded at fair value with no carryover of any allowance for loan and lease losses. There were
|
(Dollars in thousands) |
|
|
|
|
|
Commercial real estate |
|
$ |
|
|
|
Construction, land development, land |
|
|
|
|
|
1-4 family residential properties |
|
|
|
|
|
Farmland |
|
|
|
|
|
Commercial |
|
|
|
|
|
Factored receivables |
|
|
— |
|
|
Consumer |
|
|
|
|
|
Mortgage warehouse |
|
|
— |
|
|
|
|
$ |
|
|
The following presents information at the acquisition date for non-PCI loans acquired in the transaction:
|
(Dollars in thousands) |
|
|
|
|
|
Contractually required principal and interest payments |
|
$ |
|
|
|
Contractual cash flows not expected to be collected |
|
$ |
|
|
|
Fair value at acquisition |
|
$ |
|
|
Revenue and earnings of the acquired branches since the acquisition date have not been disclosed as the branches were merged into the Company and separate financial information is not readily available.
Expenses related to the acquisition, including professional fees and other transaction costs, totaling $
94
TRIUMPH BANCORP, INC. AND SUBSIDIARIES
NOTES TO CONSOLIDATED FINANCIAL STATEMENTS
Triumph Capital Advisors, LLC
On March 31, 2017, the Company sold its wholly owned asset management subsidiary, Triumph Capital Advisors, LLC (“TCA”), to an unrelated third party. The transaction was completed to enhance shareholder value and provide a platform for TCA to operate without the impact of regulations intended for depository institutions and their holding companies.
A summary of the consideration received and the gain on sale is as follows:
|
(Dollars in thousands) |
|
|
|
|
|
Consideration received (fair value): |
|
|
|
|
|
Cash |
|
$ |
|
|
|
Loan receivable |
|
|
|
|
|
Revenue share |
|
|
|
|
|
Total consideration received |
|
|
|
|
|
Carrying value of TCA membership interest |
|
|
|
|
|
Gain on sale of subsidiary |
|
|
|
|
|
Transaction costs |
|
|
|
|
|
Gain on sale of subsidiary, net of transaction costs |
|
$ |
|
|
The Company financed a portion of the consideration received with a $
In addition, the Company is entitled to receive an annual earn-out payment representing
The Company incurred pre-tax expenses related to the transaction, including professional fees and other direct transaction costs, totaling $
NOTE 3 — SECURITIES
Equity Securities with Readily Determinable Fair Values
The Company held equity securities with fair values of $
|
(Dollars in thousands) |
|
2019 |
|
|
2018 |
|
||
|
Unrealized gains (losses) on equity securities still held at the reporting date |
|
$ |
|
|
|
$ |
|
|
|
Realized gains (losses) on equity securities sold during the period |
|
|
— |
|
|
|
— |
|
|
|
|
$ |
|
|
|
$ |
|
|
95
TRIUMPH BANCORP, INC. AND SUBSIDIARIES
NOTES TO CONSOLIDATED FINANCIAL STATEMENTS
Debt Securities
Debt securities have been classified in the financial statements as available for sale or held to maturity. The amortized cost of securities and their estimated fair values are as follows:
|
|
|
|
|
|
|
Gross |
|
|
Gross |
|
|
|
|
|
||
|
(Dollars in thousands) |
|
Amortized |
|
|
Unrealized |
|
|
Unrealized |
|
|
Fair |
|
||||
|
December 31, 2019 |
|
Cost |
|
|
Gains |
|
|
Losses |
|
|
Value |
|
||||
|
Available for sale securities: |
|
|
|
|
|
|
|
|
|
|
|
|
|
|
|
|
|
U.S. Government agency obligations |
|
$ |
|
|
|
$ |
|
|
|
$ |
( |
) |
|
$ |
|
|
|
Mortgage-backed securities, residential |
|
|
|
|
|
|
|
|
|
|
( |
) |
|
|
|
|
|
Asset-backed securities |
|
|
|
|
|
|
— |
|
|
|
( |
) |
|
|
|
|
|
State and municipal |
|
|
|
|
|
|
|
|
|
|
( |
) |
|
|
|
|
|
CLO Securities |
|
|
|
|
|
|
|
|
|
|
( |
) |
|
|
|
|
|
Corporate bonds |
|
|
|
|
|
|
|
|
|
|
( |
) |
|
|
|
|
|
SBA pooled securities |
|
|
|
|
|
|
|
|
|
|
( |
) |
|
|
|
|
|
Total available for sale securities |
|
$ |
|
|
|
$ |
|
|
|
$ |
( |
) |
|
$ |
|
|
|
|
|
|
|
|
|
|
|
|
|
|
|
|
|
|
|
|
|
|
|
|
|
|
|
Gross |
|
|
Gross |
|
|
|
|
|
||
|
(Dollars in thousands) |
|
Amortized |
|
|
Unrecognized |
|
|
Unrecognized |
|
|
Fair |
|
||||
|
December 31, 2019 |
|
Cost |
|
|
Gains |
|
|
Losses |
|
|
Value |
|
||||
|
Held to maturity securities: |
|
|
|
|
|
|
|
|
|
|
|
|
|
|
|
|
|
CLO securities |
|
$ |
|
|
|
$ |
— |
|
|
$ |
( |
) |
|
$ |
|
|
|
|
|
|
|
|
|
Gross |
|
|
Gross |
|
|
|
|
|
||
|
(Dollars in thousands) |
|
Amortized |
|
|
Unrealized |
|
|
Unrealized |
|
|
Fair |
|
||||
|
December 31, 2018 |
|
Cost |
|
|
Gains |
|
|
Losses |
|
|
Value |
|
||||
|
Available for sale securities: |
|
|
|
|
|
|
|
|
|
|
|
|
|
|
|
|
|
U.S. Government agency obligations |
|
$ |
|
|
|
$ |
|
|
|
$ |
( |
) |
|
$ |
|
|
|
U.S. Treasury notes |
|
|
|
|
|
|
— |
|
|
|
( |
) |
|
|
|
|
|
Mortgage-backed securities, residential |
|
|
|
|
|
|
|
|
|
|
( |
) |
|
|
|
|
|
Asset-backed securities |
|
|
|
|
|
|
|
|
|
|
( |
) |
|
|
|
|
|
State and municipal |
|
|
|
|
|
|
|
|
|
|
( |
) |
|
|
|
|
|
Corporate bonds |
|
|
|
|
|
|
|
|
|
|
( |
) |
|
|
|
|
|
SBA pooled securities |
|
|
|
|
|
|
|
|
|
|
( |
) |
|
|
|
|
|
Total available for sale securities |
|
$ |
|
|
|
$ |
|
|
|
$ |
( |
) |
|
$ |
|
|
|
|
|
|
|
|
|
|
|
|
|
|
|
|
|
|
|
|
|
|
|
|
|
|
|
Gross |
|
|
Gross |
|
|
|
|
|
||
|
(Dollars in thousands) |
|
Amortized |
|
|
Unrecognized |
|
|
Unrecognized |
|
|
Fair |
|
||||
|
December 31, 2018 |
|
Cost |
|
|
Gains |
|
|
Losses |
|
|
Value |
|
||||
|
Held to maturity securities: |
|
|
|
|
|
|
|
|
|
|
|
|
|
|
|
|
|
CLO securities |
|
$ |
|
|
|
$ |
— |
|
|
$ |
( |
) |
|
$ |
|
|
96
TRIUMPH BANCORP, INC. AND SUBSIDIARIES
NOTES TO CONSOLIDATED FINANCIAL STATEMENTS
The amortized cost and estimated fair value of debt securities at December 31, 2019, by contractual maturity, are shown below. Expected maturities will differ from contractual maturities because issuers may have the right to call or prepay obligations with or without call or prepayment penalties.
|
|
|
Available for Sale Securities |
|
|
Held to Maturity Securities |
|
||||||||||
|
|
|
Amortized |
|
|
Fair |
|
|
Amortized |
|
|
Fair |
|
||||
|
(Dollars in thousands) |
|
Cost |
|
|
Value |
|
|
Cost |
|
|
Value |
|
||||
|
Due in one year or less |
|
$ |
|
|
|
$ |
|
|
|
$ |
— |
|
|
$ |
— |
|
|
Due from one year to five years |
|
|
|
|
|
|
|
|
|
|
— |
|
|
|
— |
|
|
Due from five years to ten years |
|
|
|
|
|
|
|
|
|
|
|
|
|
|
|
|
|
Due after ten years |
|
|
|
|
|
|
|
|
|
|
— |
|
|
|
— |
|
|
|
|
|
|
|
|
|
|
|
|
|
|
|
|
|
|
|
|
Mortgage-backed securities, residential |
|
|
|
|
|
|
|
|
|
|
— |
|
|
|
— |
|
|
Asset-backed securities |
|
|
|
|
|
|
|
|
|
|
— |
|
|
|
— |
|
|
SBA pooled securities |
|
|
|
|
|
|
|
|
|
|
— |
|
|
|
— |
|
|
|
|
$ |
|
|
|
$ |
|
|
|
$ |
|
|
|
$ |
|
|
Proceeds from sales of debt securities and the associated gross gains and losses are as follows:
|
(Dollars in thousands) |
|
2019 |
|
|
2018 |
|
|
2017 |
|
|||
|
Proceeds |
|
$ |
|
|
|
$ |
|
|
|
$ |
|
|
|
Gross gains |
|
|
|
|
|
|
|
|
|
|
|
|
|
Gross losses |
|
|
( |
) |
|
|
( |
) |
|
|
— |
|
Debt securities with a carrying amount of approximately $
Information pertaining to debt securities with gross unrealized losses, aggregated by investment category and length of time that individual securities have been in a continuous loss position, are summarized as follows:
|
|
|
Less than 12 Months |
|
|
12 Months or More |
|
|
Total |
|
|||||||||||||||
|
(Dollars in thousands) |
|
Fair |
|
|
Unrealized |
|
|
Fair |
|
|
Unrealized |
|
|
Fair |
|
|
Unrealized |
|
||||||
|
December 31, 2019 |
|
Value |
|
|
Losses |
|
|
Value |
|
|
Losses |
|
|
Value |
|
|
Losses |
|
||||||
|
Available for sale securities: |
|
|
|
|
|
|
|
|
|
|
|
|
|
|
|
|
|
|
|
|
|
|
|
|
|
U.S. Government agency obligations |
|
$ |
— |
|
|
$ |
— |
|
|
$ |
|
|
|
$ |
( |
) |
|
$ |
|
|
|
$ |
( |
) |
|
Mortgage-backed securities, residential |
|
|
|
|
|
|
( |
) |
|
|
|
|
|
|
( |
) |
|
|
|
|
|
|
( |
) |
|
Asset-backed securities |
|
|
|
|
|
|
( |
) |
|
|
|
|
|
|
( |
) |
|
|
|
|
|
|
( |
) |
|
State and municipal |
|
|
|
|
|
|
— |
|
|
|
|
|
|
|
( |
) |
|
|
|
|
|
|
( |
) |
|
CLO Securities |
|
|
|
|
|
|
( |
) |
|
|
— |
|
|
|
— |
|
|
|
|
|
|
|
( |
) |
|
Corporate bonds |
|
|
— |
|
|
|
— |
|
|
|
|
|
|
|
( |
) |
|
|
|
|
|
|
( |
) |
|
SBA pooled securities |
|
|
|
|
|
|
— |
|
|
|
|
|
|
|
( |
) |
|
|
|
|
|
|
( |
) |
|
Total available for sale securities |
|
$ |
|
|
|
$ |
( |
) |
|
$ |
|
|
|
$ |
( |
) |
|
$ |
|
|
|
$ |
( |
) |
|
|
|
|
|
|
|
|
|
|
|
|
|
|
|
|
|
|
|
|
|
|
|
|
|
|
|
|
|
Less than 12 Months |
|
|
12 Months or More |
|
|
Total |
|
|||||||||||||||
|
(Dollars in thousands) |
|
Fair |
|
|
Unrecognized |
|
|
Fair |
|
|
Unrecognized |
|
|
Fair |
|
|
Unrecognized |
|
||||||
|
December 31, 2019 |
|
Value |
|
|
Losses |
|
|
Value |
|
|
Losses |
|
|
Value |
|
|
Losses |
|
||||||
|
Held to maturity securities: |
|
|
|
|
|
|
|
|
|
|
|
|
|
|
|
|
|
|
|
|
|
|
|
|
|
CLO securities |
|
$ |
— |
|
|
$ |
— |
|
|
$ |
|
|
|
$ |
( |
) |
|
$ |
|
|
|
$ |
( |
) |
97
TRIUMPH BANCORP, INC. AND SUBSIDIARIES
NOTES TO CONSOLIDATED FINANCIAL STATEMENTS
|
|
|
Less than 12 Months |
|
|
12 Months or More |
|
|
Total |
|
|||||||||||||||
|
(Dollars in thousands) |
|
Fair |
|
|
Unrealized |
|
|
Fair |
|
|
Unrealized |
|
|
Fair |
|
|
Unrealized |
|
||||||
|
December 31, 2018 |
|
Value |
|
|
Losses |
|
|
Value |
|
|
Losses |
|
|
Value |
|
|
Losses |
|
||||||
|
Available for sale securities: |
|
|
|
|
|
|
|
|
|
|
|
|
|
|
|
|
|
|
|
|
|
|
|
|
|
U.S. Government agency obligations |
|
$ |
|
|
|
$ |
( |
) |
|
$ |
|
|
|
$ |
( |
) |
|
$ |
|
|
|
$ |
( |
) |
|
U.S. Treasury notes |
|
|
— |
|
|
|
— |
|
|
|
|
|
|
|
( |
) |
|
|
|
|
|
|
( |
) |
|
Mortgage-backed securities, residential |
|
|
|
|
|
|
( |
) |
|
|
|
|
|
|
( |
) |
|
|
|
|
|
|
( |
) |
|
Asset-backed securities |
|
|
|
|
|
|
( |
) |
|
|
|
|
|
|
( |
) |
|
|
|
|
|
|
( |
) |
|
State and municipal |
|
|
|
|
|
|
( |
) |
|
|
|
|
|
|
( |
) |
|
|
|
|
|
|
( |
) |
|
Corporate bonds |
|
|
|
|
|
|
( |
) |
|
|
|
|
|
|
( |
) |
|
|
|
|
|
|
( |
) |
|
SBA pooled securities |
|
|
|
|
|
|
( |
) |
|
|
|
|
|
|
( |
) |
|
|
|
|
|
|
( |
) |
|
Total available for sale securities |
|
$ |
|
|
|
$ |
( |
) |
|
$ |
|
|
|
$ |
( |
) |
|
$ |
|
|
|
$ |
( |
) |
|
|
|
|
|
|
|
|
|
|
|
|
|
|
|
|
|
|
|
|
|
|
|
|
|
|
|
|
|
Less than 12 Months |
|
|
12 Months or More |
|
|
Total |
|
|||||||||||||||
|
(Dollars in thousands) |
|
Fair |
|
|
Unrecognized |
|
|
Fair |
|
|
Unrecognized |
|
|
Fair |
|
|
Unrecognized |
|
||||||
|
December 31, 2018 |
|
Value |
|
|
Losses |
|
|
Value |
|
|
Losses |
|
|
Value |
|
|
Losses |
|
||||||
|
Held to maturity securities: |
|
|
|
|
|
|
|
|
|
|
|
|
|
|
|
|
|
|
|
|
|
|
|
|
|
CLO securities |
|
$ |
|
|
|
$ |
( |
) |
|
$ |
|
|
|
$ |
( |
) |
|
$ |
|
|
|
$ |
( |
) |
Management evaluates securities for other-than-temporary impairment at least on a quarterly basis, and more frequently when economic or market concerns warrant such evaluation. Consideration is given to (1) the length of time and the extent to which the fair value has been less than cost, (2) the financial condition and near-term prospects of the issuer, and (3) the intent and ability of the Company to retain its investment in the security for a period of time sufficient to allow for any anticipated recovery in fair value.
At December 31, 2019, the Company had
NOTE 4 — LOANS AND ALLOWANCE FOR LOAN AND LEASE LOSSES
Loans Held for Sale
The following table presents loans held for sale:
|
(Dollars in thousands) |
|
December 31, 2019 |
|
|
December 31, 2018 |
|
||
|
1-4 family residential |
|
$ |
|
|
|
$ |
|
|
|
Commercial |
|
|
— |
|
|
|
— |
|
|
Total loans held for sale |
|
$ |
|
|
|
$ |
|
|
98
TRIUMPH BANCORP, INC. AND SUBSIDIARIES
NOTES TO CONSOLIDATED FINANCIAL STATEMENTS
Loans Held for Investment
The following table presents the recorded investment and unpaid principal for loans held for investment:
|
|
|
December 31, 2019 |
|
|
December 31, 2018 |
|
||||||||||||||||||
|
|
|
Recorded |
|
|
Unpaid |
|
|
|
|
|
|
Recorded |
|
|
Unpaid |
|
|
|
|
|
||||
|
(Dollars in thousands) |
|
Investment |
|
|
Principal |
|
|
Difference |
|
|
Investment |
|
|
Principal |
|
|
Difference |
|
||||||
|
Commercial real estate |
|
$ |
|
|
|
$ |
|
|
|
$ |
( |
) |
|
$ |
|
|
|
$ |
|
|
|
$ |
( |
) |
|
Construction, land development, land |
|
|
|
|
|
|
|
|
|
|
( |
) |
|
|
|
|
|
|
|
|
|
|
( |
) |
|
1-4 family residential properties |
|
|
|
|
|
|
|
|
|
|
( |
) |
|
|
|
|
|
|
|
|
|
|
( |
) |
|
Farmland |
|
|
|
|
|
|
|
|
|
|
( |
) |
|
|
|
|
|
|
|
|
|
|
( |
) |
|
Commercial |
|
|
|
|
|
|
|
|
|
|
( |
) |
|
|
|
|
|
|
|
|
|
|
( |
) |
|
Factored receivables |
|
|
|
|
|
|
|
|
|
|
( |
) |
|
|
|
|
|
|
|
|
|
|
( |
) |
|
Consumer |
|
|
|
|
|
|
|
|
|
|
( |
) |
|
|
|
|
|
|
|
|
|
|
( |
) |
|
Mortgage warehouse |
|
|
|
|
|
|
|
|
|
|
— |
|
|
|
|
|
|
|
|
|
|
|
— |
|
|
Total |
|
|
|
|
|
$ |
|
|
|
$ |
( |
) |
|
|
|
|
|
$ |
|
|
|
$ |
( |
) |
|
Allowance for loan and lease losses |
|
|
( |
) |
|
|
|
|
|
|
|
|
|
|
( |
) |
|
|
|
|
|
|
|
|
|
|
|
$ |
|
|
|
|
|
|
|
|
|
|
|
$ |
|
|
|
|
|
|
|
|
|
|
The difference between the recorded investment and unpaid principal balance is primarily (1) premiums and discounts associated with acquisition date fair value adjustments on acquired loans (both PCI and non-PCI) totaling $
As of December 31, 2019, most of the Company’s non-factoring business activity is with customers located within certain states. The states of Texas (
A majority (
At December 31, 2019 and 2018, the Company had $
Loans with carrying amounts of $
During the year ended December 31, 2019, loans with carrying amounts of $
During the year ended December 31, 2018, a related party loan with a carrying amount of $
99
TRIUMPH BANCORP, INC. AND SUBSIDIARIES
NOTES TO CONSOLIDATED FINANCIAL STATEMENTS
Allowance for Loan and Lease Losses
The activity in the allowance for loan and lease losses (“ALLL”) is as follows:
|
(Dollars in thousands) |
|
Beginning |
|
|
|
|
|
|
|
|
|
|
|
|
|
|
Reclassification |
|
|
Ending |
|
|||
|
Year ended December 31, 2019 |
|
Balance |
|
|
Provision |
|
|
Charge-offs |
|
|
Recoveries |
|
|
To Held For Sale |
|
|
Balance |
|
||||||
|
Commercial real estate |
|
$ |
|
|
|
$ |
|
|
|
$ |
( |
) |
|
$ |
|
|
|
$ |
— |
|
|
$ |
|
|
|
Construction, land development, land |
|
|
|
|
|
|
|
|
|
|
( |
) |
|
|
|
|
|
|
— |
|
|
|
|
|
|
1-4 family residential properties |
|
|
|
|
|
|
|
|
|
|
( |
) |
|
|
|
|
|
|
— |
|
|
|
|
|
|
Farmland |
|
|
|
|
|
|
|
|
|
|
( |
) |
|
|
— |
|
|
|
— |
|
|
|
|
|
|
Commercial |
|
|
|
|
|
|
|
|
|
|
( |
) |
|
|
|
|
|
|
— |
|
|
|
|
|
|
Factored receivables |
|
|
|
|
|
|
|
|
|
|
( |
) |
|
|
|
|
|
|
— |
|
|
|
|
|
|
Consumer |
|
|
|
|
|
|
|
|
|
|
( |
) |
|
|
|
|
|
|
— |
|
|
|
|
|
|
Mortgage warehouse |
|
|
|
|
|
|
|
|
|
|
— |
|
|
|
— |
|
|
|
— |
|
|
|
|
|
|
|
|
$ |
|
|
|
$ |
|
|
|
$ |
( |
) |
|
$ |
|
|
|
$ |
— |
|
|
$ |
|
|
|
|
|
|
|
|
|
|
|
|
|
|
|
|
|
|
|
|
|
|
|
|
|
|
|
|
|
(Dollars in thousands) |
|
Beginning |
|
|
|
|
|
|
|
|
|
|
|
|
|
|
Reclassification |
|
|
Ending |
|
|||
|
Year ended December 31, 2018 |
|
Balance |
|
|
Provision |
|
|
Charge-offs |
|
|
Recoveries |
|
|
To Held For Sale |
|
|
Balance |
|
||||||
|
Commercial real estate |
|
$ |
|
|
|
$ |
|
|
|
$ |
( |
) |
|
$ |
|
|
|
$ |
— |
|
|
$ |
|
|
|
Construction, land development, land |
|
|
|
|
|
|
|
|
|
|
( |
) |
|
|
|
|
|
|
— |
|
|
|
|
|
|
1-4 family residential properties |
|
|
|
|
|
|
|
|
|
|
( |
) |
|
|
|
|
|
|
— |
|
|
|
|
|
|
Farmland |
|
|
|
|
|
|
|
|
|
|
( |
) |
|
|
— |
|
|
|
— |
|
|
|
|
|
|
Commercial |
|
|
|
|
|
|
|
|
|
|
( |
) |
|
|
|
|
|
|
— |
|
|
|
|
|
|
Factored receivables |
|
|
|
|
|
|
|
|
|
|
( |
) |
|
|
|
|
|
|
— |
|
|
|
|
|
|
Consumer |
|
|
|
|
|
|
|
|
|
|
( |
) |
|
|
|
|
|
|
— |
|
|
|
|
|
|
Mortgage warehouse |
|
|
|
|
|
|
|
|
|
|
— |
|
|
|
— |
|
|
|
— |
|
|
|
|
|
|
|
|
$ |
|
|
|
$ |
|
|
|
$ |
( |
) |
|
$ |
|
|
|
$ |
— |
|
|
$ |
|
|
|
|
|
|
|
|
|
|
|
|
|
|
|
|
|
|
|
|
|
|
|
|
|
|
|
|
|
(Dollars in thousands) |
|
Beginning |
|
|
|
|
|
|
|
|
|
|
|
|
|
|
Reclassification |
|
|
Ending |
|
|||
|
Year ended December 31, 2017 |
|
Balance |
|
|
Provision |
|
|
Charge-offs |
|
|
Recoveries |
|
|
To Held For Sale |
|
|
Balance |
|
||||||
|
Commercial real estate |
|
$ |
|
|
|
$ |
|
|
|
$ |
( |
) |
|
$ |
|
|
|
$ |
— |
|
|
$ |
|
|
|
Construction, land development, land |
|
|
|
|
|
|
|
|
|
|
( |
) |
|
|
|
|
|
|
— |
|
|
|
|
|
|
1-4 family residential properties |
|
|
|
|
|
|
|
|
|
|
( |
) |
|
|
|
|
|
|
— |
|
|
|
|
|
|
Farmland |
|
|
|
|
|
|
|
|
|
|
— |
|
|
|
— |
|
|
|
— |
|
|
|
|
|
|
Commercial |
|
|
|
|
|
|
|
|
|
|
( |
) |
|
|
|
|
|
|
( |
) |
|
|
|
|
|
Factored receivables |
|
|
|
|
|
|
|
|
|
|
( |
) |
|
|
|
|
|
|
— |
|
|
|
|
|
|
Consumer |
|
|
|
|
|
|
|
|
|
|
( |
) |
|
|
|
|
|
|
— |
|
|
|
|
|
|
Mortgage warehouse |
|
|
|
|
|
|
|
|
|
|
— |
|
|
|
— |
|
|
|
— |
|
|
|
|
|
|
|
|
$ |
|
|
|
$ |
|
|
|
$ |
( |
) |
|
$ |
|
|
|
$ |
( |
) |
|
$ |
|
|
100
TRIUMPH BANCORP, INC. AND SUBSIDIARIES
NOTES TO CONSOLIDATED FINANCIAL STATEMENTS
The following table presents loans individually and collectively evaluated for impairment, as well as purchased credit impaired (“PCI”) loans, and their respective ALLL allocations:
|
(Dollars in thousands) |
|
Loan Evaluation |
|
|
ALLL Allocations |
|
||||||||||||||||||||||||||
|
December 31, 2019 |
|
Individually |
|
|
Collectively |
|
|
PCI |
|
|
Total loans |
|
|
Individually |
|
|
Collectively |
|
|
PCI |
|
|
Total ALLL |
|
||||||||
|
Commercial real estate |
|
$ |
|
|
|
$ |
|
|
|
$ |
|
|
|
$ |
|
|
|
$ |
|
|
|
$ |
|
|
|
$ |
— |
|
|
$ |
|
|
|
Construction, land development, land |
|
|
|
|
|
|
|
|
|
|
|
|
|
|
|
|
|
|
|
|
|
|
|
|
|
|
— |
|
|
|
|
|
|
1-4 family residential properties |
|
|
|
|
|
|
|
|
|
|
|
|
|
|
|
|
|
|
|
|
|
|
|
|
|
|
— |
|
|
|
|
|
|
Farmland |
|
|
|
|
|
|
|
|
|
|
|
|
|
|
|
|
|
|
— |
|
|
|
|
|
|
|
— |
|
|
|
|
|
|
Commercial |
|
|
|
|
|
|
|
|
|
|
|
|
|
|
|
|
|
|
|
|
|
|
|
|
|
|
|
|
|
|
|
|
|
Factored receivables |
|
|
|
|
|
|
|
|
|
|
— |
|
|
|
|
|
|
|
|
|
|
|
|
|
|
|
— |
|
|
|
|
|
|
Consumer |
|
|
|
|
|
|
|
|
|
|
— |
|
|
|
|
|
|
|
|
|
|
|
|
|
|
|
— |
|
|
|
|
|
|
Mortgage warehouse |
|
|
— |
|
|
|
|
|
|
|
— |
|
|
|
|
|
|
|
— |
|
|
|
|
|
|
|
— |
|
|
|
|
|
|
|
|
$ |
|
|
|
$ |
|
|
|
$ |
|
|
|
$ |
|
|
|
$ |
|
|
|
$ |
|
|
|
$ |
|
|
|
$ |
|
|
|
|
|
|
|
|
|
|
|
|
|
|
|
|
|
|
|
|
|
|
|
|
|
|
|
|
|
|
|
|
|
|
|
|
|
(Dollars in thousands) |
|
Loan Evaluation |
|
|
ALLL Allocations |
|
||||||||||||||||||||||||||
|
December 31, 2018 |
|
Individually |
|
|
Collectively |
|
|
PCI |
|
|
Total loans |
|
|
Individually |
|
|
Collectively |
|
|
PCI |
|
|
Total ALLL |
|
||||||||
|
Commercial real estate |
|
$ |
|
|
|
$ |
|
|
|
$ |
|
|
|
$ |
|
|
|
$ |
|
|
|
$ |
|
|
|
$ |
— |
|
|
$ |
|
|
|
Construction, land development, land |
|
|
|
|
|
|
|
|
|
|
|
|
|
|
|
|
|
|
|
|
|
|
|
|
|
|
— |
|
|
|
|
|
|
1-4 family residential properties |
|
|
|
|
|
|
|
|
|
|
|
|
|
|
|
|
|
|
|
|
|
|
|
|
|
|
— |
|
|
|
|
|
|
Farmland |
|
|
|
|
|
|
|
|
|
|
|
|
|
|
|
|
|
|
|
|
|
|
|
|
|
|
— |
|
|
|
|
|
|
Commercial |
|
|
|
|
|
|
|
|
|
|
|
|
|
|
|
|
|
|
|
|
|
|
|
|
|
|
|
|
|
|
|
|
|
Factored receivables |
|
|
|
|
|
|
|
|
|
|
— |
|
|
|
|
|
|
|
|
|
|
|
|
|
|
|
— |
|
|
|
|
|
|
Consumer |
|
|
|
|
|
|
|
|
|
|
— |
|
|
|
|
|
|
|
|
|
|
|
|
|
|
|
— |
|
|
|
|
|
|
Mortgage warehouse |
|
|
— |
|
|
|
|
|
|
|
— |
|
|
|
|
|
|
|
— |
|
|
|
|
|
|
|
— |
|
|
|
|
|
|
|
|
$ |
|
|
|
$ |
|
|
|
$ |
|
|
|
$ |
|
|
|
$ |
|
|
|
$ |
|
|
|
$ |
|
|
|
$ |
|
|
101
TRIUMPH BANCORP, INC. AND SUBSIDIARIES
NOTES TO CONSOLIDATED FINANCIAL STATEMENTS
The following is a summary of information pertaining to impaired loans. PCI loans that have not deteriorated subsequent to acquisition are not considered impaired and therefore do not require an ALLL and are excluded from these tables.
|
|
|
Impaired Loans and PCI Impaired Loans |
|
|
Impaired Loans |
|
||||||||||||||
|
|
|
With a Valuation Allowance |
|
|
Without a Valuation Allowance |
|
||||||||||||||
|
(Dollars in thousands) |
|
Recorded |
|
|
Unpaid |
|
|
Related |
|
|
Recorded |
|
|
Unpaid |
|
|||||
|
December 31, 2019 |
|
Investment |
|
|
Principal |
|
|
Allowance |
|
|
Investment |
|
|
Principal |
|
|||||
|
Commercial real estate |
|
$ |
|
|
|
$ |
|
|
|
$ |
|
|
|
$ |
|
|
|
$ |
|
|
|
Construction, land development, land |
|
|
|
|
|
|
|
|
|
|
|
|
|
|
|
|
|
|
|
|
|
1-4 family residential properties |
|
|
|
|
|
|
|
|
|
|
|
|
|
|
|
|
|
|
|
|
|
Farmland |
|
|
— |
|
|
|
— |
|
|
|
— |
|
|
|
|
|
|
|
|
|
|
Commercial |
|
|
|
|
|
|
|
|
|
|
|
|
|
|
|
|
|
|
|
|
|
Factored receivables |
|
|
|
|
|
|
|
|
|
|
|
|
|
|
|
|
|
|
|
|
|
Consumer |
|
|
|
|
|
|
|
|
|
|
|
|
|
|
|
|
|
|
|
|
|
Mortgage warehouse |
|
|
— |
|
|
|
— |
|
|
|
— |
|
|
|
— |
|
|
|
— |
|
|
PCI |
|
|
|
|
|
|
|
|
|
|
|
|
|
|
— |
|
|
|
— |
|
|
|
|
$ |
|
|
|
$ |
|
|
|
$ |
|
|
|
$ |
|
|
|
$ |
|
|
|
|
|
|
|
|
|
|
|
|
|
|
|
|
|
|
|
|
|
|
|
|
|
|
|
Impaired Loans and PCI Impaired Loans |
|
|
Impaired Loans |
|
||||||||||||||
|
|
|
With a Valuation Allowance |
|
|
Without a Valuation Allowance |
|
||||||||||||||
|
(Dollars in thousands) |
|
Recorded |
|
|
Unpaid |
|
|
Related |
|
|
Recorded |
|
|
Unpaid |
|
|||||
|
December 31, 2018 |
|
Investment |
|
|
Principal |
|
|
Allowance |
|
|
Investment |
|
|
Principal |
|
|||||
|
Commercial real estate |
|
$ |
|
|
|
$ |
|
|
|
$ |
|
|
|
$ |
|
|
|
$ |
|
|
|
Construction, land development, land |
|
|
|
|
|
|
|
|
|
|
|
|
|
|
— |
|
|
|
— |
|
|
1-4 family residential properties |
|
|
|
|
|
|
|
|
|
|
|
|
|
|
|
|
|
|
|
|
|
Farmland |
|
|
|
|
|
|
|
|
|
|
|
|
|
|
|
|
|
|
|
|
|
Commercial |
|
|
|
|
|
|
|
|
|
|
|
|
|
|
|
|
|
|
|
|
|
Factored receivables |
|
|
|
|
|
|
|
|
|
|
|
|
|
|
— |
|
|
|
— |
|
|
Consumer |
|
|
|
|
|
|
|
|
|
|
|
|
|
|
|
|
|
|
|
|
|
Mortgage warehouse |
|
|
— |
|
|
|
— |
|
|
|
— |
|
|
|
— |
|
|
|
— |
|
|
PCI |
|
|
|
|
|
|
|
|
|
|
|
|
|
|
— |
|
|
|
— |
|
|
|
|
$ |
|
|
|
$ |
|
|
|
$ |
|
|
|
$ |
|
|
|
$ |
|
|
The following table presents average impaired loans and interest recognized on impaired loans:
|
|
|
Years Ended |
|
|||||||||||||||||||||
|
|
|
December 31, 2019 |
|
|
December 31, 2018 |
|
|
December 31, 2017 |
|
|||||||||||||||
|
|
|
Average |
|
|
Interest |
|
|
Average |
|
|
Interest |
|
|
Average |
|
|
Interest |
|
||||||
|
(Dollars in thousands) |
|
Impaired Loans |
|
|
Recognized |
|
|
Impaired Loans |
|
|
Recognized |
|
|
Impaired Loans |
|
|
Recognized |
|
||||||
|
Commercial real estate |
|
$ |
|
|
|
$ |
|
|
|
$ |
|
|
|
$ |
|
|
|
$ |
|
|
|
$ |
|
|
|
Construction, land development, land |
|
|
|
|
|
|
|
|
|
|
|
|
|
|
— |
|
|
|
|
|
|
|
— |
|
|
1-4 family residential properties |
|
|
|
|
|
|
|
|
|
|
|
|
|
|
|
|
|
|
|
|
|
|
|
|
|
Farmland |
|
|
|
|
|
|
|
|
|
|
|
|
|
|
|
|
|
|
|
|
|
|
|
|
|
Commercial |
|
|
|
|
|
|
|
|
|
|
|
|
|
|
|
|
|
|
|
|
|
|
|
|
|
Factored receivables |
|
|
|
|
|
|
— |
|
|
|
|
|
|
|
— |
|
|
|
|
|
|
|
— |
|
|
Consumer |
|
|
|
|
|
|
|
|
|
|
|
|
|
|
|
|
|
|
|
|
|
|
|
|
|
Mortgage warehouse |
|
|
— |
|
|
|
— |
|
|
|
— |
|
|
|
— |
|
|
|
— |
|
|
|
— |
|
|
PCI |
|
|
|
|
|
|
— |
|
|
|
|
|
|
|
— |
|
|
|
|
|
|
|
— |
|
|
|
|
$ |
|
|
|
$ |
|
|
|
$ |
|
|
|
$ |
|
|
|
$ |
|
|
|
$ |
|
|
102
TRIUMPH BANCORP, INC. AND SUBSIDIARIES
NOTES TO CONSOLIDATED FINANCIAL STATEMENTS
Past Due and Nonaccrual Loans
The following is a summary of contractually past due and nonaccrual loans:
|
|
|
Past Due |
|
|
Past Due 90 |
|
|
|
|
|
|
|
|
|
||
|
(Dollars in thousands) |
|
30-89 Days |
|
|
Days or More |
|
|
|
|
|
|
|
|
|
||
|
December 31, 2019 |
|
Still Accruing |
|
|
Still Accruing |
|
|
Nonaccrual |
|
|
Total |
|
||||
|
Commercial real estate |
|
$ |
|
|
|
$ |
— |
|
|
$ |
|
|
|
$ |
|
|
|
Construction, land development, land |
|
|
— |
|
|
|
— |
|
|
|
|
|
|
|
|
|
|
1-4 family residential properties |
|
|
|
|
|
|
— |
|
|
|
|
|
|
|
|
|
|
Farmland |
|
|
|
|
|
|
— |
|
|
|
|
|
|
|
|
|
|
Commercial |
|
|
|
|
|
|
— |
|
|
|
|
|
|
|
|
|
|
Factored receivables |
|
|
|
|
|
|
|
|
|
|
— |
|
|
|
|
|
|
Consumer |
|
|
|
|
|
|
— |
|
|
|
|
|
|
|
|
|
|
Mortgage warehouse |
|
|
— |
|
|
|
— |
|
|
|
— |
|
|
|
— |
|
|
PCI |
|
|
|
|
|
|
— |
|
|
|
|
|
|
|
|
|
|
|
|
$ |
|
|
|
$ |
|
|
|
$ |
|
|
|
$ |
|
|
|
|
|
Past Due |
|
|
Past Due 90 |
|
|
|
|
|
|
|
|
|
||
|
(Dollars in thousands) |
|
30-89 Days |
|
|
Days or More |
|
|
|
|
|
|
|
|
|
||
|
December 31, 2018 |
|
Still Accruing |
|
|
Still Accruing |
|
|
Nonaccrual |
|
|
Total |
|
||||
|
Commercial real estate |
|
$ |
|
|
|
$ |
|
|
|
$ |
|
|
|
$ |
|
|
|
Construction, land development, land |
|
|
|
|
|
|
— |
|
|
|
|
|
|
|
|
|
|
1-4 family residential properties |
|
|
|
|
|
|
— |
|
|
|
|
|
|
|
|
|
|
Farmland |
|
|
|
|
|
|
— |
|
|
|
|
|
|
|
|
|
|
Commercial |
|
|
|
|
|
|
|
|
|
|
|
|
|
|
|
|
|
Factored receivables |
|
|
|
|
|
|
|
|
|
|
— |
|
|
|
|
|
|
Consumer |
|
|
|
|
|
|
|
|
|
|
|
|
|
|
|
|
|
Mortgage warehouse |
|
|
— |
|
|
|
— |
|
|
|
— |
|
|
|
— |
|
|
PCI |
|
|
|
|
|
|
— |
|
|
|
|
|
|
|
|
|
|
|
|
$ |
|
|
|
$ |
|
|
|
$ |
|
|
|
$ |
|
|
The following table presents information regarding nonperforming loans:
|
(Dollars in thousands) |
|
December 31, 2019 |
|
|
December 31, 2018 |
|
||
|
Nonaccrual loans(1) |
|
$ |
|
|
|
$ |
|
|
|
Factored receivables greater than 90 days past due |
|
|
|
|
|
|
|
|
|
Troubled debt restructurings accruing interest |
|
|
|
|
|
|
|
|
|
|
|
$ |
|
|
|
$ |
|
|
(1)
103
TRIUMPH BANCORP, INC. AND SUBSIDIARIES
NOTES TO CONSOLIDATED FINANCIAL STATEMENTS
Credit Quality Information
The Company categorizes loans into risk categories based on relevant information about the ability of borrowers to service their debt, including: current collateral and financial information, historical payment experience, credit documentation, public information, and current economic trends, among other factors. The Company analyzes loans individually by classifying the loans as to credit risk on a regular basis. Large groups of smaller balance homogeneous loans, such as consumer loans, are analyzed primarily based on payment status. The Company uses the following definitions for risk ratings:
Pass – Pass rated loans have low to average risk and are not otherwise classified.
Classified – Classified loans are inadequately protected by the current net worth and paying capacity of the obligor or of the collateral pledged, if any. Loans so classified have a well-defined weakness or weaknesses that jeopardize the repayment of the debt. They are characterized by the distinct possibility that the institution will sustain some loss if the deficiencies are not corrected. Certain classified loans have the added characteristic that the weaknesses make collection or liquidation in full, on the basis of currently existing facts, conditions and values, highly questionable and improbable.
PCI – At acquisition, PCI loans had the characteristics of classified loans and it was probable, at acquisition, that all contractually required principal and interest payments would not be collected. The Company evaluates these loans on a projected cash flow basis with this evaluation performed quarterly.
As of December 31, 2019 and 2018, based on the most recent analysis performed, the risk category of loans is as follows:
|
(Dollars in thousands) |
|
|
|
|
|
|
|
|
|
|
|
|
|
|
|
|
|
December 31, 2019 |
|
Pass |
|
|
Classified |
|
|
PCI |
|
|
Total |
|
||||
|
Commercial real estate |
|
$ |
|
|
|
$ |
|
|
|
$ |
|
|
|
$ |
|
|
|
Construction, land development, land |
|
|
|
|
|
|
|
|
|
|
|
|
|
|
|
|
|
1-4 family residential |
|
|
|
|
|
|
|
|
|
|
|
|
|
|
|
|
|
Farmland |
|
|
|
|
|
|
|
|
|
|
|
|
|
|
|
|
|
Commercial |
|
|
|
|
|
|
|
|
|
|
|
|
|
|
|
|
|
Factored receivables |
|
|
|
|
|
|
|
|
|
|
— |
|
|
|
|
|
|
Consumer |
|
|
|
|
|
|
|
|
|
|
— |
|
|
|
|
|
|
Mortgage warehouse |
|
|
|
|
|
|
— |
|
|
|
— |
|
|
|
|
|
|
|
|
$ |
|
|
|
$ |
|
|
|
$ |
|
|
|
$ |
|
|
|
(Dollars in thousands) |
|
|
|
|
|
|
|
|
|
|
|
|
|
|
|
|
|
December 31, 2018 |
|
Pass |
|
|
Classified |
|
|
PCI |
|
|
Total |
|
||||
|
Commercial real estate |
|
$ |
|
|
|
$ |
|
|
|
$ |
|
|
|
$ |
|
|
|
Construction, land development, land |
|
|
|
|
|
|
|
|
|
|
|
|
|
|
|
|
|
1-4 family residential |
|
|
|
|
|
|
|
|
|
|
|
|
|
|
|
|
|
Farmland |
|
|
|
|
|
|
|
|
|
|
|
|
|
|
|
|
|
Commercial |
|
|
|
|
|
|
|
|
|
|
|
|
|
|
|
|
|
Factored receivables |
|
|
|
|
|
|
|
|
|
|
— |
|
|
|
|
|
|
Consumer |
|
|
|
|
|
|
|
|
|
|
— |
|
|
|
|
|
|
Mortgage warehouse |
|
|
|
|
|
|
— |
|
|
|
— |
|
|
|
|
|
|
|
|
$ |
|
|
|
$ |
|
|
|
$ |
|
|
|
$ |
|
|
Troubled Debt Restructurings
The Company had a recorded investment in troubled debt restructurings of $
104
TRIUMPH BANCORP, INC. AND SUBSIDIARIES
NOTES TO CONSOLIDATED FINANCIAL STATEMENTS
The following table presents the pre- and post-modification recorded investment of loans modified as troubled debt restructurings during the years ended December 31, 2019, 2018, and 2017. The Company did not grant principal reductions on any restructured loans.
|
|
|
|
|
|
|
|
|
|
|
|
|
|
|
Extended |
|
|
|
|
|
|
|
|
|
|
|
|
|
Extended |
|
|
|
|
|
|
|
|
|
|
Maturity and |
|
|
|
|
|
|
|
|
|
||
|
|
|
Amortization |
|
|
Payment |
|
|
AB Note |
|
|
Reduced |
|
|
Total |
|
|
Number of |
|
||||||
|
(Dollars in thousands) |
|
Period |
|
|
Deferrals |
|
|
Restructure |
|
|
Interest Rate |
|
|
Modifications |
|
|
Loans |
|
||||||
|
December 31, 2019 |
|
|
|
|
|
|
|
|
|
|
|
|
|
|
|
|
|
|
|
|
|
|
|
|
|
Commercial real estate |
|
$ |
— |
|
|
$ |
— |
|
|
$ |
|
|
|
$ |
— |
|
|
$ |
|
|
|
|
|
|
|
1-4 family residential properties |
|
|
— |
|
|
|
|
|
|
|
— |
|
|
|
— |
|
|
|
|
|
|
|
|
|
|
Farmland |
|
|
— |
|
|
|
— |
|
|
|
— |
|
|
|
— |
|
|
|
— |
|
|
|
— |
|
|
Commercial |
|
|
|
|
|
|
|
|
|
|
— |
|
|
|
|
|
|
|
|
|
|
|
|
|
|
|
|
$ |
|
|
|
$ |
|
|
|
$ |
|
|
|
$ |
|
|
|
$ |
|
|
|
|
|
|
|
|
|
|
|
|
|
|
|
|
|
|
|
|
|
|
|
|
|
|
|
|
|
|
|
|
|
December 31, 2018 |
|
|
|
|
|
|
|
|
|
|
|
|
|
|
|
|
|
|
|
|
|
|
|
|
|
Commercial real estate |
|
$ |
— |
|
|
$ |
|
|
|
$ |
— |
|
|
$ |
— |
|
|
$ |
|
|
|
|
|
|
|
1-4 family residential properties |
|
|
|
|
|
|
— |
|
|
|
— |
|
|
|
— |
|
|
|
|
|
|
|
|
|
|
Farmland |
|
|
|
|
|
|
— |
|
|
|
— |
|
|
|
— |
|
|
|
|
|
|
|
|
|
|
Commercial |
|
|
|
|
|
|
— |
|
|
|
— |
|
|
|
— |
|
|
|
|
|
|
|
|
|
|
|
|
$ |
|
|
|
$ |
|
|
|
$ |
— |
|
|
$ |
— |
|
|
$ |
|
|
|
|
|
|
|
|
|
|
|
|
|
|
|
|
|
|
|
|
|
|
|
|
|
|
|
|
|
|
|
|
|
December 31, 2017 |
|
|
|
|
|
|
|
|
|
|
|
|
|
|
|
|
|
|
|
|
|
|
|
|
|
Commercial |
|
$ |
|
|
|
$ |
— |
|
|
$ |
— |
|
|
$ |
— |
|
|
$ |
|
|
|
|
|
|
During the year ended December 31, 2019, the Company had
Residential Real Estate Loans In Process of Foreclosure
At December 31, 2019 and 2018, the Company had $
Purchased Credit Impaired Loans
The Company has loans that were acquired for which there was, at acquisition, evidence of deterioration of credit quality since origination and for which it was probable, at acquisition, that all contractually required payments would not be collected.
|
|
|
December 31, |
|
|
December 31, |
|
||
|
(Dollars in thousands) |
|
2019 |
|
|
2018 |
|
||
|
Contractually required principal and interest: |
|
|
|
|
|
|
|
|
|
Real estate loans |
|
$ |
|
|
|
$ |
|
|
|
Commercial loans |
|
|
|
|
|
|
|
|
|
Outstanding contractually required principal and interest |
|
$ |
|
|
|
$ |
|
|
|
Gross carrying amount included in loans receivable |
|
$ |
|
|
|
$ |
|
|
105
TRIUMPH BANCORP, INC. AND SUBSIDIARIES
NOTES TO CONSOLIDATED FINANCIAL STATEMENTS
The changes in accretable yield in regard to loans transferred at acquisition for which it was probable that all contractually required payments would not be collected are as follows:
|
|
|
Years Ended December 31, |
|
|||||||||
|
(Dollars in thousands) |
|
2019 |
|
|
2018 |
|
|
2017 |
|
|||
|
Accretable yield, beginning balance |
|
$ |
|
|
|
$ |
|
|
|
$ |
|
|
|
Additions |
|
|
— |
|
|
|
|
|
|
|
|
|
|
Accretion |
|
|
( |
) |
|
|
( |
) |
|
|
( |
) |
|
Reclassification from nonaccretable to accretable yield |
|
|
|
|
|
|
|
|
|
|
|
|
|
Disposals |
|
|
( |
) |
|
|
— |
|
|
|
( |
) |
|
Accretable yield, ending balance |
|
$ |
|
|
|
$ |
|
|
|
$ |
|
|
NOTE 5 — OTHER REAL ESTATE OWNED
Other real estate owned activity was as follows:
|
|
|
Years Ended December 31, |
|
|||||||||
|
(Dollars in thousands) |
|
2019 |
|
|
2018 |
|
|
2017 |
|
|||
|
Beginning balance |
|
$ |
|
|
|
$ |
|
|
|
$ |
|
|
|
Acquired through business acquisition |
|
|
— |
|
|
|
|
|
|
|
|
|
|
Loans transferred to OREO |
|
|
|
|
|
|
|
|
|
|
|
|
|
Premises transferred to OREO |
|
|
— |
|
|
|
|
|
|
|
|
|
|
Net OREO gains (losses) and valuation adjustments |
|
|
|
|
|
|
( |
) |
|
|
( |
) |
|
Sales of OREO |
|
|
( |
) |
|
|
( |
) |
|
|
( |
) |
|
Ending balance |
|
$ |
|
|
|
$ |
|
|
|
$ |
|
|
NOTE 6 — PREMISES AND EQUIPMENT
Premises and Equipment
Premises and equipment consisted of the following:
|
|
|
December 31, |
|
|
December 31, |
|
||
|
(Dollars in thousands) |
|
2019 |
|
|
2018 |
|
||
|
Land |
|
$ |
|
|
|
$ |
|
|
|
Buildings |
|
|
|
|
|
|
|
|
|
Leasehold improvements |
|
|
|
|
|
|
|
|
|
Automobiles and aircraft |
|
|
|
|
|
|
|
|
|
Furniture, fixtures and equipment |
|
|
|
|
|
|
|
|
|
|
|
|
|
|
|
|
|
|
|
Accumulated depreciation |
|
|
( |
) |
|
|
( |
) |
|
|
|
$ |
|
|
|
$ |
|
|
Depreciation expense was $
Leases
The Company leases certain premises and equipment under operating leases. At December 31, 2019, the Company had lease liabilities totaling $
106
TRIUMPH BANCORP, INC. AND SUBSIDIARIES
NOTES TO CONSOLIDATED FINANCIAL STATEMENTS
Lease costs were as follows:
|
|
|
Year Ended December 31, |
|
|
|
(Dollars in thousands) |
|
2019 |
|
|
|
Operating lease cost |
|
$ |
|
|
|
Short-term lease cost |
|
|
— |
|
|
Variable lease cost |
|
|
|
|
|
Total lease cost |
|
$ |
|
|
Rent expense for the years ended December 31, 2018 and 2017, prior to the adoption of ASU 2016-02, was $
There were
A maturity analysis of operating lease liabilities and reconciliation of the undiscounted cash flows to the total operating lease liability is as follows:
|
(Dollars in thousands) |
|
2019 |
|
|
|
Lease payments due: |
|
|
|
|
|
Within one year |
|
$ |
|
|
|
After one but within two years |
|
|
|
|
|
After two but within three years |
|
|
|
|
|
After three but within four years |
|
|
|
|
|
After four but within five years |
|
|
|
|
|
After five years |
|
|
|
|
|
Total undiscounted cash flows |
|
|
|
|
|
Discount on cash flows |
|
|
( |
) |
|
Total lease liability |
|
$ |
|
|
NOTE 7 — GOODWILL AND INTANGIBLE ASSETS
Goodwill and intangible assets consist of the following:
|
|
|
December 31, |
|
|
December 31, |
|
||
|
(Dollars in thousands) |
|
2019 |
|
|
2018 |
|
||
|
Goodwill |
|
$ |
|
|
|
$ |
|
|
|
|
|
December 31, 2019 |
|
|
December 31, 2018 |
|
||||||||||||||||||
|
|
|
Gross Carrying |
|
|
Accumulated |
|
|
Net Carrying |
|
|
Gross Carrying |
|
|
Accumulated |
|
|
Net Carrying |
|
||||||
|
(Dollars in thousands) |
|
Amount |
|
|
Amortization |
|
|
Amount |
|
|
Amount |
|
|
Amortization |
|
|
Amount |
|
||||||
|
Core deposit intangibles |
|
$ |
|
|
|
$ |
( |
) |
|
$ |
|
|
|
$ |
|
|
|
$ |
( |
) |
|
$ |
|
|
|
Other intangible assets |
|
|
|
|
|
|
( |
) |
|
|
|
|
|
|
|
|
|
|
( |
) |
|
|
|
|
|
|
|
$ |
|
|
|
$ |
( |
) |
|
$ |
|
|
|
$ |
|
|
|
$ |
( |
) |
|
$ |
|
|
107
TRIUMPH BANCORP, INC. AND SUBSIDIARIES
NOTES TO CONSOLIDATED FINANCIAL STATEMENTS
The changes in goodwill and intangible assets by operating segment during the year are as follows:
|
(Dollars in thousands) |
|
|
|
|
|
|
|
|
|
|
|
|
|
|
|
|
|
December 31, 2019 |
|
Banking |
|
|
Factoring |
|
|
Corporate |
|
|
Total |
|
||||
|
Beginning balance |
|
$ |
|
|
|
$ |
|
|
|
$ |
— |
|
|
$ |
|
|
|
Amortization of intangibles |
|
|
( |
) |
|
|
( |
) |
|
|
— |
|
|
|
( |
) |
|
Ending balance |
|
$ |
|
|
|
$ |
|
|
|
$ |
— |
|
|
$ |
|
|
|
|
|
|
|
|
|
|
|
|
|
|
|
|
|
|
|
|
|
|
|
|
|
|
|
|
|
|
|
|
|
|
|
|
|
|
|
(Dollars in thousands) |
|
|
|
|
|
|
|
|
|
|
|
|
|
|
|
|
|
December 31, 2018 |
|
Banking |
|
|
Factoring |
|
|
Corporate |
|
|
Total |
|
||||
|
Beginning balance |
|
$ |
|
|
|
$ |
|
|
|
$ |
— |
|
|
$ |
|
|
|
Acquired goodwill |
|
|
|
|
|
|
|
|
|
|
— |
|
|
|
|
|
|
Acquired intangibles |
|
|
|
|
|
|
|
|
|
|
— |
|
|
|
|
|
|
Amortization of intangibles |
|
|
( |
) |
|
|
( |
) |
|
|
— |
|
|
|
( |
) |
|
Divestiture of intangibles |
|
|
( |
) |
|
|
— |
|
|
|
— |
|
|
|
( |
) |
|
Ending balance |
|
$ |
|
|
|
$ |
|
|
|
$ |
— |
|
|
$ |
|
|
|
|
|
|
|
|
|
|
|
|
|
|
|
|
|
|
|
|
|
(Dollars in thousands) |
|
|
|
|
|
|
|
|
|
|
|
|
|
|
|
|
|
December 31, 2017 |
|
Banking |
|
|
Factoring |
|
|
Corporate |
|
|
Total |
|
||||
|
Beginning balance |
|
$ |
|
|
|
$ |
|
|
|
$ |
|
|
|
$ |
|
|
|
Acquired goodwill |
|
|
|
|
|
|
— |
|
|
|
— |
|
|
|
|
|
|
Acquired intangibles |
|
|
|
|
|
|
— |
|
|
|
— |
|
|
|
|
|
|
Amortization of intangibles |
|
|
( |
) |
|
|
( |
) |
|
|
( |
) |
|
|
( |
) |
|
Divestiture of intangibles |
|
|
— |
|
|
|
— |
|
|
|
( |
) |
|
|
( |
) |
|
Reclass of goodwill to assets held for sale |
|
|
( |
) |
|
|
— |
|
|
|
— |
|
|
|
( |
) |
|
Reclass of intangibles to assets held for sale |
|
|
( |
) |
|
|
— |
|
|
|
— |
|
|
|
( |
) |
|
Ending balance |
|
$ |
|
|
|
$ |
|
|
|
$ |
— |
|
|
$ |
|
|
Impairment exists when a reporting unit’s carrying value of goodwill exceeds its fair value. The Company assesses goodwill for impairment at its reporting units that contain goodwill, Banking and Factoring. At the measurement date, these reporting units had positive equity and the Company elected to perform qualitative assessments to determine if it was more likely than not that the fair value of the reporting units exceeded their carrying values, including goodwill. The qualitative assessment indicated that it was more likely than not that the fair value of the reporting unit exceeded its carrying value, resulting in
After performing an impairment test comparing the carrying value of intangible assets to the fair value of intangible assets during the years ended December 31, 2019 and 2018, it was determined that the fair value of the intangible assets exceeded their carrying amount and thus, no intangible asset impairment was recorded. During the year ended December 31, 2017, it was determined that the carrying amount of core deposit intangibles related to public funds assigned to the Banking segment exceeded the fair value of these core deposit intangibles, resulting in an impairment charge of $
108
TRIUMPH BANCORP, INC. AND SUBSIDIARIES
NOTES TO CONSOLIDATED FINANCIAL STATEMENTS
Generally, material acquired intangible assets are being amortized utilizing an accelerated method over their estimated useful lives, which range from 8 to
|
(Dollars in thousands) |
|
|
|
|
|
2020 |
|
$ |
|
|
|
2021 |
|
|
|
|
|
2022 |
|
|
|
|
|
2023 |
|
|
|
|
|
2024 |
|
|
|
|
|
Thereafter |
|
|
|
|
|
|
|
$ |
|
|
NOTE 8 — EQUITY METHOD INVESTMENT
On October 17, 2019, the Company made a minority equity investment of $
At December 31, 2019, the Company’s investment in WSI totaled $
The Company has made an accounting policy election to record its equity method earnings from the investment in WSI common stock on a one quarter lag. As the Company’s initial investment was made during the quarter ended December 31, 2019, the Company did
NOTE 9 — VARIABLE INTEREST ENTITIES
Collateralized Loan Obligation Funds - Closed
The Company, through its subsidiary Triumph Capital Advisors, acted as the asset manager or provided certain middle and back office staffing and services to the asset manager of various Collateralized Loan Obligation (“CLO”) funds. TCA earned asset management fees in accordance with the terms of its asset management or staffing and services agreements associated with the CLO funds. TCA earned asset management fees totaling $
The Company holds investments in the subordinated notes of the following closed CLO funds:
|
|
Offering |
|
Offering |
|
|
|
(Dollars in thousands) |
Date |
|
Amount |
|
|
|
Trinitas CLO IV, LTD (Trinitas IV) |
|
|
$ |
|
|
|
Trinitas CLO V, LTD (Trinitas V) |
|
|
$ |
|
|
|
Trinitas CLO VI, LTD (Trinitas VI) |
|
|
$ |
|
|
The carrying amounts of the Company’s investments in the subordinated notes of the CLO funds, which represent the Company’s maximum exposure to loss as a result of its involvement with the CLO funds, totaled $
109
TRIUMPH BANCORP, INC. AND SUBSIDIARIES
NOTES TO CONSOLIDATED FINANCIAL STATEMENTS
The Company performed a consolidation analysis to confirm whether the Company was required to consolidate the assets, liabilities, equity or operations of the closed CLO funds in its financial statements. The Company concluded that the closed CLO funds are variable interest entities and that the Company holds variable interests in the entities in the form of its investments in the subordinated notes of the entities. However, the Company also concluded that the Company does not have the power to direct the activities that most significantly impact the entities’ economic performance. As a result, the Company is not the primary beneficiary and therefore is not required to consolidate the assets, liabilities, equity or operations of the CLO funds in the Company’s financial statements.
Collateralized Loan Obligation Funds – Warehouse Phase
From time to time, the Company may invest in the subordinated debt of entities formed to be the issuers of CLO offerings during their warehouse phases. The Company’s investments in these CLO funds are repaid when the CLO funds’ warehouse phases are closed and the CLO offerings are issued. The Company’s maximum exposure to loss as a result of its involvement with these CLO funds is limited to the carrying amount of its investments in the subordinated debt of the CLO funds. The Company did
The Company performed a consolidation analysis of CLO funds during their warehouse phases and concluded that the CLO funds were variable interest entities and that the Company held a variable interest in the entities that could potentially be significant to the entities in the form of its investments in the subordinated notes of the entities. However, the Company also concluded that the Company did not have the power to direct the activities that most significantly impact the entities’ economic performance. As a result, the Company was not the primary beneficiary and therefore was not required to consolidate the assets, liabilities, equity, or operations of the entities in the Company’s financial statements.
NOTE 10 — Deposits
Deposits are summarized as follows:
|
(Dollars in thousands) |
|
December 31, 2019 |
|
|
December 31, 2018 |
|
||
|
Noninterest bearing demand |
|
$ |
|
|
|
$ |
|
|
|
Interest bearing demand |
|
|
|
|
|
|
|
|
|
Individual retirement accounts |
|
|
|
|
|
|
|
|
|
Money market |
|
|
|
|
|
|
|
|
|
Savings |
|
|
|
|
|
|
|
|
|
Certificates of deposit |
|
|
|
|
|
|
|
|
|
Brokered deposits |
|
|
|
|
|
|
|
|
|
Total deposits |
|
$ |
|
|
|
$ |
|
|
At December 31, 2019, scheduled maturities of time deposits, including certificates of deposits, individual retirement accounts and brokered deposits, are as follows:
|
(Dollars in thousands) |
|
December 31, 2019 |
|
|
|
Within one year |
|
$ |
|
|
|
After one but within two years |
|
|
|
|
|
After two but within three years |
|
|
|
|
|
After three but within four years |
|
|
|
|
|
After four but within five years |
|
|
|
|
|
Total |
|
$ |
|
|
Time deposits, including individual retirement accounts, certificates of deposit, and brokered deposits, with individual balances of $250,000 and greater totaled $
110
TRIUMPH BANCORP, INC. AND SUBSIDIARIES
NOTES TO CONSOLIDATED FINANCIAL STATEMENTS
NOTE 11 — BORROWINGS AND BORROWING CAPACITY
Customer Repurchase Agreements
Customer repurchase agreements are overnight customer sweep arrangements.
|
|
|
December 31, |
|
|
December 31, |
|
||
|
(Dollars in thousands) |
|
2019 |
|
|
2018 |
|
||
|
Amount outstanding at end of the year |
|
$ |
|
|
|
$ |
|
|
|
Weighted average interest rate at end of the year |
|
|
|
% |
|
|
|
% |
|
Average daily balance during the year |
|
$ |
|
|
|
$ |
|
|
|
Weighted average interest rate during the year |
|
|
|
% |
|
|
|
% |
|
Maximum month-end balance during the year |
|
$ |
|
|
|
$ |
|
|
Customer repurchase agreements are secured by pledged securities with carrying amounts as follows:
|
|
|
December 31, |
|
|
December 31, |
|
||
|
(Dollars in thousands) |
|
2019 |
|
|
2018 |
|
||
|
U.S. Government agency obligations |
|
$ |
|
|
|
$ |
|
|
FHLB Advances
FHLB advances are collateralized by assets, including a blanket pledge of certain loans. FHLB advances and weighted average interest rates at end of period by contractual maturity are summarized as follows:
|
|
|
Fixed Rate |
|
|
Variable Rate |
|
||||||||||
|
(Dollars in thousands) |
|
Balance Outstanding |
|
|
Weighted Average Interest Rate |
|
|
Balance Outstanding |
|
|
Weighted Average Interest Rate |
|
||||
|
2020 |
|
$ |
|
|
|
|
|
% |
|
$ |
— |
|
|
|
— |
|
|
2027 |
|
|
— |
|
|
|
— |
|
|
|
|
|
|
|
|
% |
|
|
|
$ |
|
|
|
|
|
% |
|
$ |
|
|
|
|
|
% |
Information concerning FHLB advances is summarized as follows:
|
|
|
December 31, |
|
|
December 31, |
|
||
|
(Dollars in thousands) |
|
2019 |
|
|
2018 |
|
||
|
Amount outstanding at end of the year |
|
$ |
|
|
|
$ |
|
|
|
Weighted average interest rate at end of the year |
|
|
|
% |
|
|
|
% |
|
Average daily balance during the year |
|
$ |
|
|
|
$ |
|
|
|
Weighted average interest rate during the year |
|
|
|
% |
|
|
|
% |
|
Maximum month-end balance during the year |
|
$ |
|
|
|
$ |
|
|
The Company’s unused borrowing capacity with the FHLB is as follows:
|
|
|
December 31, |
|
|
December 31, |
|
||
|
(Dollars in thousands) |
|
2019 |
|
|
2018 |
|
||
|
Borrowing capacity |
|
$ |
|
|
|
$ |
|
|
|
Borrowings outstanding |
|
|
|
|
|
|
|
|
|
Unused borrowing capacity |
|
$ |
|
|
|
$ |
|
|
Federal Funds Purchased
The Company had
111
TRIUMPH BANCORP, INC. AND SUBSIDIARIES
NOTES TO CONSOLIDATED FINANCIAL STATEMENTS
Subordinated Notes
On September 30, 2016, the Company issued $
The 2016 Notes are included on the consolidated balance sheets as liabilities at their carrying values of $
On November 27, 2019, the Company issued $
The 2019 Notes are included on the consolidated balance sheets as liabilities at their carrying values of $
The 2016 Notes and the 2019 Notes are subordinated in right of payment to the Company’s existing and future senior indebtedness and are structurally subordinated to the Company’s subsidiaries’ existing and future indebtedness and other obligations.
Junior Subordinated Debentures
The following provides a summary of the Company’s junior subordinated debentures:
|
|
|
|
|
|
|
|
|
|
|
|
|
Variable |
|
Interest Rate At |
|
|
|
(Dollars in thousands) |
|
Face Value |
|
|
Carrying Value |
|
|
Maturity Date |
|
Interest Rate |
|
December 31, 2019 |
|
|||
|
National Bancshares Capital Trust II |
|
$ |
|
|
|
$ |
|
|
|
|
|
|
|
|
|
|
|
National Bancshares Capital Trust III |
|
|
|
|
|
|
|
|
|
|
|
|
|
|
|
|
|
ColoEast Capital Trust I |
|
|
|
|
|
|
|
|
|
|
|
|
|
|
|
|
|
ColoEast Capital Trust II |
|
|
|
|
|
|
|
|
|
|
|
|
|
|
|
|
|
Valley Bancorp Statutory Trust I |
|
|
|
|
|
|
|
|
|
|
|
|
|
|
|
|
|
Valley Bancorp Statutory Trust II |
|
|
|
|
|
|
|
|
|
|
|
|
|
|
|
|
|
|
|
$ |
|
|
|
$ |
|
|
|
|
|
|
|
|
|
|
These debentures are unsecured obligations due to trusts that are unconsolidated subsidiaries. The debentures were issued in conjunction with the trusts’ issuances of obligated capital securities. The trusts used the proceeds from the issuances of their capital securities to buy floating rate junior subordinated deferrable interest debentures that bear the same interest rate and terms as the capital securities. These debentures are the trusts’ only assets and the interest payments from the debentures finance the distributions paid on the capital securities. These debentures rank junior and are subordinate in the right of payment to all other debt of the Company.
As part of the purchase accounting adjustments made with the National Bancshares, Inc. acquisition on October 15, 2013, the ColoEast acquisition on August 1, 2016, and the Valley acquisition on December 9, 2017, the Company adjusted the carrying value of the junior subordinated debentures to fair value as of the respective acquisition dates. The discount on the debentures will continue to be amortized through maturity and recognized as a component of interest expense.
112
TRIUMPH BANCORP, INC. AND SUBSIDIARIES
NOTES TO CONSOLIDATED FINANCIAL STATEMENTS
The debentures may be called by the Company at par plus any accrued but unpaid interest. Interest on the debentures is calculated quarterly. The distribution rate payable on the capital securities is cumulative and payable quarterly in arrears. The Company has the right to defer payments on interest on the debentures at any time by extending the interest payment period for a period not exceeding 20 consecutive quarters with respect to each deferral period, provided that no extension period may extend beyond the redemption or maturity date of the debentures.
The debentures are included on the consolidated balance sheet as liabilities; however, for regulatory purposes, the carrying value of these obligations are eligible for inclusion in Tier I regulatory capital, subject to certain limitations. All of the carrying value of $
NOTE 12 — EMPLOYEE BENEFIT PLANS
401(k) Plan
The Company sponsors a 401(k) benefit plan that allows employee contributions up to the maximum tax-deferred limitations established by the Internal Revenue Code, which are matched by the Company equal to
NOTE 13 — INCOME TAXES
Income tax expense consisted of the following:
|
|
|
Years Ended December 31, |
|
|||||||||
|
(Dollars in thousands) |
|
2019 |
|
|
2018 |
|
|
2017 |
|
|||
|
Income tax expense: |
|
|
|
|
|
|
|
|
|
|
|
|
|
Current |
|
$ |
|
|
|
$ |
|
|
|
$ |
|
|
|
Deferred |
|
|
|
|
|
|
|
|
|
|
|
|
|
Change in valuation allowance for deferred tax asset |
|
|
|
|
|
|
( |
) |
|
|
( |
) |
|
Income tax expense |
|
$ |
|
|
|
$ |
|
|
|
$ |
|
|
Effective tax rates differ from federal statutory rates applied to income before income taxes due to the following:
|
|
|
Years Ended December 31, |
|
|||||||||
|
(Dollars in thousands) |
|
2019 |
|
|
2018 |
|
|
2017 |
|
|||
|
Tax provision computed at federal statutory rate |
|
$ |
|
|
|
$ |
|
|
|
$ |
|
|
|
Effect of: |
|
|
|
|
|
|
|
|
|
|
|
|
|
State taxes, net |
|
|
|
|
|
|
|
|
|
|
|
|
|
Tax reform impact(1) |
|
|
— |
|
|
|
— |
|
|
|
|
|
|
Bank-owned life insurance |
|
|
( |
) |
|
|
( |
) |
|
|
( |
) |
|
Tax exempt interest |
|
|
( |
) |
|
|
( |
) |
|
|
( |
) |
|
Change in valuation allowance for deferred tax asset |
|
|
|
|
|
|
( |
) |
|
|
( |
) |
|
Other |
|
|
( |
) |
|
|
( |
) |
|
|
|
|
|
Income tax expense |
|
$ |
|
|
|
$ |
|
|
|
$ |
|
|
(1)
113
TRIUMPH BANCORP, INC. AND SUBSIDIARIES
NOTES TO CONSOLIDATED FINANCIAL STATEMENTS
Deferred income taxes reflect the net tax effects of temporary differences between the recorded amounts of assets and liabilities for financial reporting purposes and the amounts used for income tax purposes. Significant components of the Company’s deferred tax assets and liabilities are as follows:
|
(Dollars in thousands) |
|
2019 |
|
|
2018 |
|
||
|
Deferred tax assets |
|
|
|
|
|
|
|
|
|
Federal net operating loss carryforwards |
|
$ |
|
|
|
$ |
|
|
|
State net operating loss carryforwards |
|
|
|
|
|
|
|
|
|
Acquired loan basis |
|
|
|
|
|
|
|
|
|
Other real estate owned |
|
|
|
|
|
|
|
|
|
AMT credit carryforward |
|
|
|
|
|
|
|
|
|
Allowance for loan losses |
|
|
|
|
|
|
|
|
|
Unrealized loss on securities available for sale |
|
|
— |
|
|
|
|
|
|
Accrued liabilities |
|
|
|
|
|
|
|
|
|
Lease liability |
|
|
|
|
|
|
— |
|
|
Other |
|
|
|
|
|
|
|
|
|
Total deferred tax assets |
|
|
|
|
|
|
|
|
|
Deferred tax liabilities |
|
|
|
|
|
|
|
|
|
Goodwill and intangible assets |
|
|
|
|
|
|
|
|
|
Fair value adjustment on junior subordinated debentures |
|
|
|
|
|
|
|
|
|
Premises and equipment |
|
|
|
|
|
|
|
|
|
Installment gain on sale of subsidiary |
|
|
|
|
|
|
|
|
|
Lease right-of-use asset |
|
|
|
|
|
|
— |
|
|
Unrealized gain on securities available for sale |
|
|
|
|
|
|
— |
|
|
Other |
|
|
|
|
|
|
|
|
|
Total deferred tax liabilities |
|
|
|
|
|
|
|
|
|
Net deferred tax asset before valuation allowance |
|
|
|
|
|
|
|
|
|
Valuation allowance |
|
|
( |
) |
|
|
( |
) |
|
Net deferred tax asset |
|
$ |
|
|
|
$ |
|
|
The Company's federal and state net operating loss carryforwards as of December 31, 2019 were $
The Company's federal and state net operating loss carryforwards as of December 31, 2018 were $
An Internal Revenue Code Section 382 (“Section 382”) ownership change was triggered as part of previous acquisitions. A significant portion of the deferred tax asset relating to the Company's net operating loss carryforwards is subject to the annual limitation rules under Section 382. The utilization of tax carryforward attributes acquired from the EJ Financial Corp. (2010) acquisition is subject to an annual limitation of $
The utilization of deferred tax assets related to the net operating loss and tax credit carryforwards acquired from the 2016 ColoEast stock acquisition are subject to an annual limitation of $
At December 31, 2019 and 2018, the Company had
The Company is subject to U.S. federal income tax as well as income tax in various states. The Company is generally not subject to examination by taxing authorities for years prior to 2016.
114
TRIUMPH BANCORP, INC. AND SUBSIDIARIES
NOTES TO CONSOLIDATED FINANCIAL STATEMENTS
NOTE 14 — Legal Contingencies
Various legal claims arise from time to time in the normal course of business which, in the opinion of management, will have no material effect on the Company’s consolidated financial statements. The Company does not anticipate any material losses as a result of commitments and contingent liabilities.
NOTE 15 — OFF-BALANCE SHEET LOAN COMMITMENTS
From time to time, the Company is a party to financial instruments with off-balance sheet risk in the normal course of business to meet the financing needs of its customers. These financial instruments include commitments to extend credit. Those instruments involve, to varying degrees, elements of credit risk in excess of the amount recognized in the balance sheet. The Company’s exposure to credit loss in the event of nonperformance by the other party to the financial instrument for commitments to extend credit and standby letters of credit is represented by the contractual amount of those instruments.
The Company uses the same credit policies in making commitments and conditional obligations as it does for on-balance sheet financial instruments.
The contractual amounts of financial instruments with off-balance sheet risk were as follows:
|
|
|
December 31, 2019 |
|
|
December 31, 2018 |
|
||||||||||||||||||
|
(Dollars in thousands) |
|
Fixed Rate |
|
|
Variable Rate |
|
|
Total |
|
|
Fixed Rate |
|
|
Variable Rate |
|
|
Total |
|
||||||
|
Unused lines of credit |
|
$ |
|
|
|
$ |
|
|
|
$ |
|
|
|
$ |
|
|
|
$ |
|
|
|
$ |
|
|
|
Standby letters of credit |
|
$ |
|
|
|
$ |
|
|
|
$ |
|
|
|
$ |
|
|
|
$ |
|
|
|
$ |
|
|
|
Commitments to purchase loans |
|
$ |
— |
|
|
$ |
|
|
|
$ |
|
|
|
$ |
— |
|
|
$ |
— |
|
|
$ |
— |
|
|
Mortgage warehouse commitments |
|
$ |
— |
|
|
$ |
|
|
|
$ |
|
|
|
$ |
— |
|
|
$ |
|
|
|
$ |
|
|
115
TRIUMPH BANCORP, INC. AND SUBSIDIARIES
NOTES TO CONSOLIDATED FINANCIAL STATEMENTS
Commitments to extend credit are agreements to lend to a customer as long as there is no violation of any condition established in the contract. Commitments generally have fixed expiration dates or other termination clauses and may require payment of a fee. Since many of the commitments are expected to expire without being fully drawn upon, the total commitment amounts disclosed above do not necessarily represent future cash requirements. The Company evaluates each customer’s creditworthiness on a case-by-case basis. The amount of collateral obtained, if considered necessary by the Company, upon extension of credit, is based on management’s credit evaluation of the customer.
Standby letters of credit are conditional commitments issued by the Company to guarantee the performance of a customer to a third party. In the event of nonperformance by the customer, the Company has rights to the underlying collateral, which can include commercial real estate, physical plant and property, inventory, receivables, cash and marketable securities. The credit risk to the Company in issuing letters of credit is essentially the same as that involved in extending loan facilities to its customers.
Commitments to purchase loans represent loans purchased by the Company that have not yet settled.
Mortgage warehouse commitments are unconditionally cancellable and represent the unused capacity on mortgage warehouse facilities the Company has approved. The Company reserves the right to refuse to buy any mortgage loans offered for sale by a customer, for any reason, at the Company’s sole and absolute discretion.
The Company records an allowance for credit losses on off balance sheet credit exposures through a charge to other noninterest expense on the Company’s consolidated statements of income. At December 31, 2019 and 2018, the allowance for credit losses on off balance sheet credit exposures totaled $
In addition to the commitments above, the Company had overdraft protection available in the amounts of $
NOTE 16 — Fair Value Disclosures
Fair value is the exchange price that would be received for an asset or paid to transfer a liability (exit price) in the principal or most advantageous market for the asset or liability in an orderly transaction between market participants on the measurement date. There are three levels of inputs that may be used to measure fair values:
Level 1 – Quoted prices (unadjusted) for identical assets or liabilities in active markets that the entity has the ability to access as of the measurement date.
Level 2 – Significant other observable inputs other than Level 1 prices such as quoted prices for similar assets or liabilities; quoted prices in markets that are not active; or other inputs that are observable or can be corroborated by observable market data.
Level 3 – Significant unobservable inputs that reflect a company’s own assumptions about the assumptions that market participants would use in pricing an asset or liability.
116
TRIUMPH BANCORP, INC. AND SUBSIDIARIES
NOTES TO CONSOLIDATED FINANCIAL STATEMENTS
Assets and liabilities measured at fair value on a recurring basis are summarized in the table below.
|
(Dollars in thousands) |
|
Fair Value Measurements Using |
|
|
Total |
|
||||||||||
|
December 31, 2019 |
|
Level 1 |
|
|
Level 2 |
|
|
Level 3 |
|
|
Fair Value |
|
||||
|
Assets measured at fair value on a recurring basis |
|
|
|
|
|
|
|
|
|
|
|
|
|
|
|
|
|
Securities available for sale |
|
|
|
|
|
|
|
|
|
|
|
|
|
|
|
|
|
U.S. Government agency obligations |
|
$ |
— |
|
|
$ |
|
|
|
$ |
— |
|
|
$ |
|
|
|
Mortgage-backed securities, residential |
|
|
— |
|
|
|
|
|
|
|
— |
|
|
|
|
|
|
Asset-backed securities |
|
|
— |
|
|
|
|
|
|
|
— |
|
|
|
|
|
|
State and municipal |
|
|
— |
|
|
|
|
|
|
|
— |
|
|
|
|
|
|
CLO Securities |
|
|
— |
|
|
|
|
|
|
|
— |
|
|
|
|
|
|
Corporate bonds |
|
|
— |
|
|
|
|
|
|
|
— |
|
|
|
|
|
|
SBA pooled securities |
|
|
— |
|
|
|
|
|
|
|
— |
|
|
|
|
|
|
|
|
$ |
— |
|
|
$ |
|
|
|
$ |
— |
|
|
$ |
|
|
|
|
|
|
|
|
|
|
|
|
|
|
|
|
|
|
|
|
|
Equity securities |
|
|
|
|
|
|
|
|
|
|
|
|
|
|
|
|
|
Mutual fund |
|
$ |
|
|
|
$ |
— |
|
|
$ |
— |
|
|
$ |
|
|
|
|
|
|
|
|
|
|
|
|
|
|
|
|
|
|
|
|
|
Loans held for sale |
|
$ |
— |
|
|
$ |
|
|
|
$ |
— |
|
|
$ |
|
|
|
|
|
|
|
|
|
|
|
|
|
|
|
|
|
|
|
|
|
Liabilities measured at fair value on a recurring basis |
|
|
|
|
|
|
|
|
|
|
|
|
|
|
|
|
|
ICC Contingent consideration |
|
$ |
— |
|
|
$ |
— |
|
|
$ |
|
|
|
$ |
|
|
|
(Dollars in thousands) |
|
Fair Value Measurements Using |
|
|
Total |
|
||||||||||
|
December 31, 2018 |
|
Level 1 |
|
|
Level 2 |
|
|
Level 3 |
|
|
Fair Value |
|
||||
|
Assets measured at fair value on a recurring basis |
|
|
|
|
|
|
|
|
|
|
|
|
|
|
|
|
|
Securities available for sale |
|
|
|
|
|
|
|
|
|
|
|
|
|
|
|
|
|
U.S. Government agency obligations |
|
$ |
— |
|
|
$ |
|
|
|
$ |
— |
|
|
$ |
|
|
|
U.S. Treasury notes |
|
|
— |
|
|
|
|
|
|
|
— |
|
|
|
|
|
|
Mortgage-backed securities, residential |
|
|
— |
|
|
|
|
|
|
|
— |
|
|
|
|
|
|
Asset-backed securities |
|
|
— |
|
|
|
|
|
|
|
— |
|
|
|
|
|
|
State and municipal |
|
|
— |
|
|
|
|
|
|
|
— |
|
|
|
|
|
|
Corporate bonds |
|
|
— |
|
|
|
|
|
|
|
— |
|
|
|
|
|
|
SBA pooled securities |
|
|
— |
|
|
|
|
|
|
|
— |
|
|
|
|
|
|
|
|
$ |
— |
|
|
$ |
|
|
|
$ |
— |
|
|
$ |
|
|
|
|
|
|
|
|
|
|
|
|
|
|
|
|
|
|
|
|
|
Equity securities |
|
|
|
|
|
|
|
|
|
|
|
|
|
|
|
|
|
Mutual fund |
|
$ |
|
|
|
$ |
— |
|
|
$ |
— |
|
|
$ |
|
|
|
|
|
|
|
|
|
|
|
|
|
|
|
|
|
|
|
|
|
Loans held for sale |
|
$ |
— |
|
|
$ |
|
|
|
$ |
— |
|
|
$ |
|
|
|
|
|
|
|
|
|
|
|
|
|
|
|
|
|
|
|
|
|
Liabilities measured at fair value on a recurring basis |
|
|
|
|
|
|
|
|
|
|
|
|
|
|
|
|
|
ICC Contingent consideration |
|
$ |
— |
|
|
$ |
— |
|
|
$ |
|
|
|
$ |
|
|
The Company used the following methods and assumptions to estimate fair value of financial instruments that are measured at fair value on a recurring basis:
Securities available for sale – The fair values of debt securities available for sale are determined by third party matrix pricing, which is a mathematical technique widely used in the industry to value debt securities without relying exclusively on quoted prices for the specific securities but rather by relying on the securities’ relationship to other benchmark quoted securities (Level 2 inputs).
Equity securities – The fair values of equity securities are determined based on quoted market prices in active markets and are classified in Level 1 of the valuation hierarchy.
117
TRIUMPH BANCORP, INC. AND SUBSIDIARIES
NOTES TO CONSOLIDATED FINANCIAL STATEMENTS
Loans held for sale – The fair value of loans held for sale is determined using commitments on hand from investors or prevailing market prices and are classified in Level 2 of the valuation hierarchy.
ICC contingent consideration – The fair value of the ICC contingent consideration is based on a proprietary index designed to approximate the rise and fall of transportation invoice prices subsequent to acquisition and is correlated to monthly movements in average invoice prices historically experienced by ICC. The index is calculated by a third party data analytics firm and is correlated to monthly movements in average invoice prices historically experienced by ICC. At the end of a
|
(Dollars in thousands) |
|
2019 |
|
|
2018 |
|
||
|
Beginning balance |
|
$ |
|
|
|
$ |
— |
|
|
Contingent consideration recognized in business combination |
|
— |
|
|
|
|
|
|
|
Change in fair value of contingent consideration recognized in earnings |
|
|
|
|
|
|
|
|
|
Consideration settlement payments |
|
— |
|
|
|
— |
|
|
|
Ending balance |
|
$ |
|
|
|
$ |
|
|
There were
Assets measured at fair value on a non-recurring basis are summarized in the table below. There were
|
(Dollars in thousands) |
|
Fair Value Measurements Using |
|
|
Total |
|
||||||||||
|
December 31, 2019 |
|
Level 1 |
|
|
Level 2 |
|
|
Level 3 |
|
|
Fair Value |
|
||||
|
Impaired loans |
|
|
|
|
|
|
|
|
|
|
|
|
|
|
|
|
|
Commercial real estate |
|
$ |
— |
|
|
$ |
— |
|
|
$ |
|
|
|
$ |
|
|
|
Construction, land development, land |
|
|
— |
|
|
|
— |
|
|
|
|
|
|
|
|
|
|
1-4 family residential properties |
|
|
— |
|
|
|
— |
|
|
|
|
|
|
|
|
|
|
Commercial |
|
|
— |
|
|
|
— |
|
|
|
|
|
|
|
|
|
|
Factored receivables |
|
|
— |
|
|
|
— |
|
|
|
|
|
|
|
|
|
|
Consumer |
|
|
— |
|
|
|
— |
|
|
|
|
|
|
|
|
|
|
PCI |
|
|
— |
|
|
|
— |
|
|
|
|
|
|
|
|
|
|
Other real estate owned (1): |
|
|
|
|
|
|
|
|
|
|
|
|
|
|
|
|
|
Commercial |
|
|
— |
|
|
|
— |
|
|
|
|
|
|
|
|
|
|
1-4 family residential properties |
|
|
— |
|
|
|
— |
|
|
|
|
|
|
|
|
|
|
|
|
$ |
— |
|
|
$ |
— |
|
|
$ |
|
|
|
$ |
|
|
|
|
|
|
|
|
|
|
|
|
|
|
|
|
|
|
|
|
|
(Dollars in thousands) |
|
Fair Value Measurements Using |
|
|
Total |
|
||||||||||
|
December 31, 2018 |
|
Level 1 |
|
|
Level 2 |
|
|
Level 3 |
|
|
Fair Value |
|
||||
|
Impaired loans |
|
|
|
|
|
|
|
|
|
|
|
|
|
|
|
|
|
Commercial real estate |
|
$ |
— |
|
|
$ |
— |
|
|
$ |
|
|
|
$ |
|
|
|
Construction, land development, land |
|
|
— |
|
|
|
— |
|
|
|
|
|
|
|
|
|
|
1-4 family residential properties |
|
|
— |
|
|
|
— |
|
|
|
|
|
|
|
|
|
|
Farmland |
|
|
— |
|
|
|
— |
|
|
|
|
|
|
|
|
|
|
Commercial |
|
|
— |
|
|
|
— |
|
|
|
|
|
|
|
|
|
|
Factored receivables |
|
|
— |
|
|
|
— |
|
|
|
|
|
|
|
|
|
|
Consumer |
|
|
— |
|
|
|
— |
|
|
|
|
|
|
|
|
|
|
PCI |
|
|
— |
|
|
|
— |
|
|
|
|
|
|
|
|
|
|
Other real estate owned (1): |
|
|
|
|
|
|
|
|
|
|
|
|
|
|
|
|
|
Commercial |
|
|
— |
|
|
|
— |
|
|
|
|
|
|
|
|
|
|
|
|
$ |
— |
|
|
$ |
— |
|
|
$ |
|
|
|
$ |
|
|
118
TRIUMPH BANCORP, INC. AND SUBSIDIARIES
NOTES TO CONSOLIDATED FINANCIAL STATEMENTS
(1) Represents the fair value of OREO that was adjusted subsequent to its initial classification as OREO.
As of December 31, 2019 and 2018, the only Level 3 assets with material unobservable inputs are associated with impaired loans and OREO.
Impaired Loans with Specific Allocation of ALLL
A loan is considered impaired when, based on current information and events, it is probable that the Company will be unable to collect all amounts due pursuant to the contractual terms of the loan agreement. Impairment is measured by estimating the fair value of the loan based on the present value of expected cash flows, the market price of the loan, or the underlying fair value of the loan’s collateral. For real estate loans, fair value of the impaired loan’s collateral is determined by third party appraisals, which are then adjusted for the estimated selling and closing costs related to liquidation of the collateral. For this asset class, the actual valuation methods (income, sales comparable, or cost) vary based on the status of the project or property. For example, land is generally based on the sales comparable method while construction is based on the income and/or sales comparable methods. The unobservable inputs may vary depending on the individual assets with no one of the three methods being the predominant approach. The Company reviews the third party appraisal for appropriateness and adjusts the value downward to consider selling and closing costs, which typically range from
OREO
OREO is primarily comprised of real estate acquired in partial or full satisfaction of loans. OREO is recorded at its estimated fair value less estimated selling and closing costs at the date of transfer, with any excess of the related loan balance over the fair value less expected selling costs charged to the ALLL. Subsequent changes in fair value are reported as adjustments to the carrying amount and are recorded against earnings. The Company outsources the valuation of OREO with material balances to third party appraisers. For this asset class, the actual valuation methods (income, sales comparable, or cost) vary based on the status of the project or property. For example, land is generally based on the sales comparable method while construction is based on the income and/or sales comparable methods. The unobservable inputs may vary depending on the individual assets with no one of the three methods being the predominant approach. The Company reviews the third party appraisal for appropriateness and adjusts the value downward to consider selling and closing costs, which typically range from
119
TRIUMPH BANCORP, INC. AND SUBSIDIARIES
NOTES TO CONSOLIDATED FINANCIAL STATEMENTS
The estimated fair values of the Company’s financial instruments not measured at fair value on a recurring or non-recurring basis were as follows:
|
|
|
December 31, 2019 |
|
|||||||||||||||||
|
|
|
Carrying |
|
|
Fair Value Measurements Using |
|
|
Total |
|
|||||||||||
|
(Dollars in thousands) |
|
Amount |
|
|
Level 1 |
|
|
Level 2 |
|
|
Level 3 |
|
|
Fair Value |
|
|||||
|
Financial assets: |
|
|
|
|
|
|
|
|
|
|
|
|
|
|
|
|
|
|
|
|
|
Cash and cash equivalents |
|
$ |
|
|
|
$ |
|
|
|
$ |
— |
|
|
$ |
— |
|
|
$ |
|
|
|
Securities - held to maturity |
|
|
|
|
|
|
— |
|
|
|
— |
|
|
|
|
|
|
|
|
|
|
Loans not previously presented, gross |
|
|
|
|
|
|
|
|
|
|
— |
|
|
|
|
|
|
|
|
|
|
FHLB and other restricted stock |
|
|
|
|
|
N/A |
|
|
N/A |
|
|
N/A |
|
|
N/A |
|
||||
|
Accrued interest receivable |
|
|
|
|
|
|
|
|
|
|
— |
|
|
|
— |
|
|
|
|
|
|
|
|
|
|
|
|
|
|
|
|
|
|
|
|
|
|
|
|
|
|
|
|
Financial liabilities: |
|
|
|
|
|
|
|
|
|
|
|
|
|
|
|
|
|
|
|
|
|
Deposits |
|
|
|
|
|
|
— |
|
|
|
|
|
|
|
— |
|
|
|
|
|
|
Customer repurchase agreements |
|
|
|
|
|
|
— |
|
|
|
|
|
|
|
— |
|
|
|
|
|
|
Federal Home Loan Bank advances |
|
|
|
|
|
|
— |
|
|
|
|
|
|
|
— |
|
|
|
|
|
|
Subordinated notes |
|
|
|
|
|
|
— |
|
|
|
|
|
|
|
— |
|
|
|
|
|
|
Junior subordinated debentures |
|
|
|
|
|
|
— |
|
|
|
|
|
|
|
— |
|
|
|
|
|
|
Accrued interest payable |
|
|
|
|
|
|
|
|
|
|
— |
|
|
|
— |
|
|
|
|
|
|
|
|
|
|
|
|
|
|
|
|
|
|
|
|
|
|
|
|
|
|
|
|
|
|
|
|
|
|
|
|
|
|
|
|
|
|
|
|
|
|
|
|
|
|
|
|
|
|
|
|
|
|
|
|
|
|
|
|
|
|
|
|
|
|
|
|
|
|
December 31, 2018 |
|
|||||||||||||||||
|
|
|
Carrying |
|
|
Fair Value Measurements Using |
|
|
Total |
|
|||||||||||
|
(Dollars in thousands) |
|
Amount |
|
|
Level 1 |
|
|
Level 2 |
|
|
Level 3 |
|
|
Fair Value |
|
|||||
|
Financial assets: |
|
|
|
|
|
|
|
|
|
|
|
|
|
|
|
|
|
|
|
|
|
Cash and cash equivalents |
|
$ |
|
|
|
$ |
|
|
|
$ |
— |
|
|
$ |
— |
|
|
$ |
|
|
|
Securities - held to maturity |
|
|
|
|
|
|
— |
|
|
|
— |
|
|
|
|
|
|
|
|
|
|
Loans not previously presented, gross |
|
|
|
|
|
|
— |
|
|
|
— |
|
|
|
|
|
|
|
|
|
|
FHLB and other restricted stock |
|
|
|
|
|
N/A |
|
|
N/A |
|
|
N/A |
|
|
N/A |
|
||||
|
Accrued interest receivable |
|
|
|
|
|
|
|
|
|
|
— |
|
|
|
— |
|
|
|
|
|
|
|
|
|
|
|
|
|
|
|
|
|
|
|
|
|
|
|
|
|
|
|
|
Financial liabilities: |
|
|
|
|
|
|
|
|
|
|
|
|
|
|
|
|
|
|
|
|
|
Deposits |
|
|
|
|
|
|
— |
|
|
|
|
|
|
|
— |
|
|
|
|
|
|
Customer repurchase agreements |
|
|
|
|
|
|
— |
|
|
|
|
|
|
|
— |
|
|
|
|
|
|
Federal Home Loan Bank advances |
|
|
|
|
|
|
— |
|
|
|
|
|
|
|
— |
|
|
|
|
|
|
Subordinated notes |
|
|
|
|
|
|
— |
|
|
|
|
|
|
|
— |
|
|
|
|
|
|
Junior subordinated debentures |
|
|
|
|
|
|
— |
|
|
|
|
|
|
|
— |
|
|
|
|
|
|
Accrued interest payable |
|
|
|
|
|
|
|
|
|
|
— |
|
|
|
— |
|
|
|
|
|
For those financial instruments not previously described, the following methods and assumptions were used by the Company in estimating the fair values of financial instruments as disclosed herein:
Cash and Cash Equivalents
For financial instruments with a shorter term or with no stated maturity, prevailing market rates, and limited credit risk, the carrying amounts approximate fair value and are considered a Level 1 classification.
Securities held to maturity
The fair values of the Company’s investments in the subordinated notes of Trinitas IV, Trinitas V, and Trinitas VI classified as securities held to maturity are determined based on the securities’ discounted projected future cash flows (net present value), resulting in a Level 3 classification.
120
TRIUMPH BANCORP, INC. AND SUBSIDIARIES
NOTES TO CONSOLIDATED FINANCIAL STATEMENTS
Loans
Loans include loans held for investment, excluding impaired loans previously described above. For variable rate loans that reprice frequently and have no significant changes in credit risk, excluding previously presented impaired loans measured at fair value on a non-recurring basis, fair values are based on carrying values. Fair values for fixed rate loans are estimated using discounted cash flow analyses. The discount rates used to determine the fair value of loans use interest rate spreads that reflect factors such as liquidity, credit, and nonperformance risk of the loans. These loans are considered a Level 3 classification.
The fair values of commercial loans in the Company’s liquid credit portfolio are determined based on quoted market prices in active markets and are considered a Level 1 classification.
FHLB and other restricted stock
FHLB and other restricted stock is restricted to member banks and there are restrictions placed on its transferability. As a result, the fair value of FHLB and other restricted stock was not practicable to determine.
Deposits
The fair values disclosed for demand deposits and non-maturity transaction accounts are, by definition, equal to the amount payable on demand at the reporting date (that is, their carrying amounts) and are considered a Level 2 classification. Fair values for fixed rate time deposits are estimated using a discounted cash flow calculation that applies interest rates currently being offered on time deposits to a schedule of aggregated expected monthly maturities on time deposits resulting in a Level 2 classification.
Customer repurchase agreements
The carrying amount of customer repurchase agreements approximates fair value due to their short term nature. The customer repurchase agreement fair value is considered a Level 2 classification.
Federal Home Loan Bank advances
The Company’s FHLB advances have variable rates or a maturity of less than three months and therefore fair value materially approximates carrying value and is considered a Level 2 classification.
Subordinated notes
The subordinated notes were valued based on quoted market prices, but due to limited trading activity for the subordinated notes in these markets, the subordinated notes are considered a Level 2 classification.
Junior subordinated debentures
The junior subordinated debentures were valued by discounting future cash flows using current interest rates for similar financial instruments, resulting in a Level 2 classification.
Accrued Interest Receivable and Accrued Interest Payable
The carrying amounts of accrued interest receivable and accrued interest payable approximate their fair values given the short term nature of the receivables and are considered a Level 1 classification.
NOTE 17 — RELATED-PARTY TRANSACTIONS
In the ordinary course of business, we have granted loans to executive officers, directors, and their affiliates were as follows:
|
|
|
Years Ended December 31, |
|
|||||
|
(Dollars in thousands) |
|
2019 |
|
|
2018 |
|
||
|
Beginning balance |
|
$ |
|
|
|
$ |
|
|
|
New loans and advances |
|
|
|
|
|
|
|
|
|
Repayments and sales |
|
|
( |
) |
|
|
( |
) |
|
Ending balance |
|
$ |
|
|
|
$ |
|
|
In December 2018, the Company sold a loan with an aggregate principal balance of $
121
TRIUMPH BANCORP, INC. AND SUBSIDIARIES
NOTES TO CONSOLIDATED FINANCIAL STATEMENTS
to the interests of such director in the borrower for such loan, was sold at a purchase price equal to
At December 31, 2019 and 2018, there were no loans to executive officers, directors, or their affiliates that were considered non-performing or potential problem loans.
Deposits from executive officers, directors, and their affiliates at December 31, 2019 and 2018 were $
Trinitas Capital Management, LLC
Trinitas Capital Management, LLC (“Trinitas”) is an independent CLO asset manager formed in 2015. Prior to the sale of TCA on March 31, 2017, certain of the Company’s officers and other personnel served as officers or managers of Trinitas and certain members of the Company’s board of directors also hold minority membership interests in Trinitas. The Company does not hold any membership interests in Trinitas.
As described in Note 9 – Variable Interest Entities, the Company, through its subsidiary TCA, provided certain middle and back office staffing and services to Trinitas as the asset manager of various CLO funds issued by Trinitas. For the year ended December 31, 2017, TCA earned fees from Trinitas totaling $
Triumph Consolidated Cos., LLC
As described in Note 19 – Stockholders’ Equity, Triumph Consolidated Cos., LLC held a warrant to purchase shares of the Company’s common stock which was exercised during the year ended December 31, 2017. Prior to its dissolution during the year ended December 31, 2017, certain of the Company’s directors and executive officers were directors, officers, investors, or other interest holders in Triumph Consolidated Cos., LLC.
NOTE 18 — REGULATORY MATTERS
The Company (on a consolidated basis) and TBK Bank are subject to various regulatory capital requirements administered by federal and state banking agencies. Failure to meet minimum capital requirements can initiate certain mandatory and possibly additional discretionary actions by regulators that, if undertaken, could have a direct material effect on the Company’s or TBK Bank’s financial statements. Under capital adequacy guidelines and the regulatory framework for prompt corrective action, the Company and TBK Bank must meet specific capital guidelines that involve quantitative measures of their assets, liabilities, and certain off balance sheet items as calculated under regulatory accounting practices. The capital amounts and classification are also subject to qualitative judgments by the regulators about components, risk weightings, and other factors.
Quantitative measures established by regulation to ensure capital adequacy require the Company and TBK Bank to maintain minimum amounts and ratios (set forth in the table below) of total, common equity Tier 1, and Tier 1 capital to risk weighted assets, and of Tier 1 capital to average assets. Management believes, as of December 31, 2019, the Company and TBK Bank meet all capital adequacy requirements to which they are subject.
As of December 31, 2019, TBK Bank’s capital ratios exceeded those levels necessary to be categorized as “well capitalized” under the regulatory framework for prompt corrective action. To be categorized as “well capitalized,” TBK Bank must maintain minimum total risk based, common equity Tier 1 risk based, Tier 1 risk based, and Tier 1 leverage ratios as set forth in the table below. There are no conditions or events since December 31, 2019 that management believes have changed TBK Bank’s category.
122
TRIUMPH BANCORP, INC. AND SUBSIDIARIES
NOTES TO CONSOLIDATED FINANCIAL STATEMENTS
The actual capital amounts and ratios for the Company and TBK Bank are presented in the following table:
|
|
|
|
|
|
|
|
|
To Be Well |
|
|||||||||||||||
|
|
|
|
|
|
|
|
|
Capitalized Under |
|
|||||||||||||||
|
|
|
|
|
|
Minimum for Capital |
|
|
Prompt Corrective |
|
|||||||||||||||
|
|
|
Actual |
|
|
Adequacy Purposes |
|
|
Action Provisions |
|
|||||||||||||||
|
(Dollars in thousands) |
|
Amount |
|
|
Ratio |
|
|
Amount |
|
|
Ratio |
|
|
Amount |
|
|
Ratio |
|
||||||
|
As of December 31, 2019 |
|
|
|
|
|
|
|
|
|
|
|
|
|
|
|
|
|
|
|
|
|
|
|
|
|
Total capital (to risk weighted assets) |
|
|
|
|
|
|
|
|
|
|
|
|
|
|
|
|
|
|
|
|
|
|
|
|
|
Triumph Bancorp, Inc. |
|
$ |
|
|
|
|
|
|
$ |
|
|
|
|
|
|
|
N/A |
|
|
N/A |
|
|||
|
TBK Bank, SSB |
|
$ |
|
|
|
|
|
|
$ |
|
|
|
|
|
|
|
$ |
|
|
|
|
|
|
|
|
|
|
|
|
|
|
|
|
|
|
|
|
|
|
|
|
|
|
|
|
|
|
|
|
|
|
Tier 1 capital (to risk weighted assets) |
|
|
|
|
|
|
|
|
|
|
|
|
|
|
|
|
|
|
|
|
|
|
|
|
|
Triumph Bancorp, Inc. |
|
$ |
|
|
|
|
|
|
$ |
|
|
|
|
|
|
|
N/A |
|
|
N/A |
|
|||
|
TBK Bank, SSB |
|
$ |
|
|
|
|
|
|
$ |
|
|
|
|
|
|
|
$ |
|
|
|
|
|
|
|
|
|
|
|
|
|
|
|
|
|
|
|
|
|
|
|
|
|
|
|
|
|
|
|
|
|
|
Common equity Tier 1 capital (to risk weighted assets) |
|
|
|
|
|
|
|
|
|
|
|
|
|
|
|
|
|
|
|
|
|
|
|
|
|
Triumph Bancorp, Inc. |
|
$ |
|
|
|
|
|
|
$ |
|
|
|
|
|
|
|
N/A |
|
|
N/A |
|
|||
|
TBK Bank, SSB |
|
$ |
|
|
|
|
|
|
$ |
|
|
|
|
|
|
|
$ |
|
|
|
|
|
|
|
|
|
|
|
|
|
|
|
|
|
|
|
|
|
|
|
|
|
|
|
|
|
|
|
|
|
|
Tier 1 capital (to average assets) |
|
|
|
|
|
|
|
|
|
|
|
|
|
|
|
|
|
|
|
|
|
|
|
|
|
Triumph Bancorp, Inc. |
|
$ |
|
|
|
|
|
|
$ |
|
|
|
|
|
|
|
N/A |
|
|
N/A |
|
|||
|
TBK Bank, SSB |
|
$ |
|
|
|
|
|
|
$ |
|
|
|
|
|
|
|
$ |
|
|
|
|
|
|
|
|
|
|
|
|
|
|
|
|
|
|
|
|
|
|
|
|
|
|
|
|
|
|
|
|
|
|
As of December 31, 2018 |
|
|
|
|
|
|
|
|
|
|
|
|
|
|
|
|
|
|
|
|
|
|
|
|
|
Total capital (to risk weighted assets) |
|
|
|
|
|
|
|
|
|
|
|
|
|
|
|
|
|
|
|
|
|
|
|
|
|
Triumph Bancorp, Inc. |
|
$ |
|
|
|
|
|
|
$ |
|
|
|
|
|
|
|
N/A |
|
|
N/A |
|
|||
|
TBK Bank, SSB |
|
$ |
|
|
|
|
|
|
$ |
|
|
|
|
|
|
|
$ |
|
|
|
|
|
|
|
|
|
|
|
|
|
|
|
|
|
|
|
|
|
|
|
|
|
|
|
|
|
|
|
|
|
|
Tier 1 capital (to risk weighted assets) |
|
|
|
|
|
|
|
|
|
|
|
|
|
|
|
|
|
|
|
|
|
|
|
|
|
Triumph Bancorp, Inc. |
|
$ |
|
|
|
|
|
|
$ |
|
|
|
|
|
|
|
N/A |
|
|
N/A |
|
|||
|
TBK Bank, SSB |
|
$ |
|
|
|
|
|
|
$ |
|
|
|
|
|
|
|
$ |
|
|
|
|
|
|
|
|
|
|
|
|
|
|
|
|
|
|
|
|
|
|
|
|
|
|
|
|
|
|
|
|
|
|
Common equity Tier 1 capital (to risk weighted assets) |
|
|
|
|
|
|
|
|
|
|
|
|
|
|
|
|
|
|
|
|
|
|
|
|
|
Triumph Bancorp, Inc. |
|
$ |
|
|
|
|
|
|
$ |
|
|
|
|
|
|
|
N/A |
|
|
N/A |
|
|||
|
TBK Bank, SSB |
|
$ |
|
|
|
|
|
|
$ |
|
|
|
|
|
|
|
$ |
|
|
|
|
|
|
|
|
|
|
|
|
|
|
|
|
|
|
|
|
|
|
|
|
|
|
|
|
|
|
|
|
|
|
Tier 1 capital (to average assets) |
|
|
|
|
|
|
|
|
|
|
|
|
|
|
|
|
|
|
|
|
|
|
|
|
|
Triumph Bancorp, Inc. |
|
$ |
|
|
|
|
|
|
$ |
|
|
|
|
|
|
|
N/A |
|
|
N/A |
|
|||
|
TBK Bank, SSB |
|
$ |
|
|
|
|
|
|
$ |
|
|
|
|
|
|
|
$ |
|
|
|
|
|
|
|
Dividends paid by TBK Bank are limited to, without prior regulatory approval, current year earnings and earnings less dividends paid during the preceding two years.
Beginning in January 2016, the implementation of the capital conservation buffer set forth by the Basel III regulatory capital framework was effective for the Company starting at
123
TRIUMPH BANCORP, INC. AND SUBSIDIARIES
NOTES TO CONSOLIDATED FINANCIAL STATEMENTS
NOTE 19 — STOCKHOLDERS’ EQUITY
The following summarizes the Company’s capital structure.
Common Stock
|
|
|
December 31, |
|
|||||
|
(Dollars in thousands, except per share amounts) |
|
2019 |
|
|
2018 |
|
||
|
Shares authorized |
|
|
|
|
|
|
|
|
|
Shares issued |
|
|
|
|
|
|
|
|
|
Treasury shares |
|
|
|
|
|
|
|
|
|
Shares outstanding |
|
|
|
|
|
|
|
|
|
Par value per share |
|
$ |
|
|
|
$ |
|
|
Common Stock Offerings
On April 12, 2018, the Company completed an underwritten common stock offering issuing
On August 1, 2017, the Company completed an underwritten common stock offering issuing
Stock Repurchase Program
On October 29, 2018, the Company announced that its board of directors had authorized the Company to repurchase up to $
On July 17, 2019, the Company’s board of directors authorized the Company to repurchase up to an additional $
On October 16, 2019 the Company’s board of directors authorized the Company to repurchase up to an additional $
The following repurchases were made under these programs:
|
(Dollars in thousands, except per share amounts) |
|
Stock Repurchase Program Authorized |
|
|
|
|
|
|||||||||
|
Year ended December 31, 2019 |
|
October 29, 2018 |
|
|
July 17, 2019 |
|
|
October 16, 2019 |
|
|
Total |
|
||||
|
Shares repurchased into treasury stock |
|
|
|
|
|
|
|
|
|
|
|
|
|
|
|
|
|
Average price of shares repurchased into treasury stock |
|
$ |
|
|
|
$ |
|
|
|
$ |
|
|
|
$ |
|
|
|
Total cost of shares repurchased into treasury stock |
|
$ |
|
|
|
$ |
|
|
|
$ |
|
|
|
$ |
|
|
There were
Warrants
During 2012, the Company issued a warrant to Triumph Consolidated Cos., LLC to purchase
124
TRIUMPH BANCORP, INC. AND SUBSIDIARIES
NOTES TO CONSOLIDATED FINANCIAL STATEMENTS
shares withheld by the Company to cover the exercise price. The shares of common stock were issued in reliance on Section 4(a)(2) of the Securities Act of 1933, as amended.
Preferred Stock
The Company did
On October 26, 2018, the
On October 26, 2018, the remaining
NOTE 20 — STOCK BASED COMPENSATION
Stock based compensation expense that has been charged against income was $
2014 Omnibus Incentive Plan
The Company’s 2014 Omnibus Incentive Plan (“Omnibus Incentive Plan”) provides for the grant of nonqualified and incentive stock options, stock appreciation rights, restricted stock awards, restricted stock units, and other awards that may be settled in, or based upon the value of, the Company’s common stock. The aggregate number of shares of common stock available for issuance under the Omnibus Incentive Plan is
Restricted Stock Awards
A summary of changes in the Company’s nonvested Restricted Stock Awards (“RSAs”) under the Omnibus Incentive Plan for the year ended December 31, 2019 were as follows:
|
|
|
|
|
|
|
Weighted Average |
|
|
|
|
|
|
|
|
|
Grant Date |
|
|
|
Nonvested RSAs |
|
Shares |
|
|
Fair Value |
|
||
|
Nonvested at January 1, 2019 |
|
|
|
|
|
$ |
|
|
|
Granted |
|
|
|
|
|
|
|
|
|
Vested |
|
|
( |
) |
|
|
|
|
|
Forfeited |
|
|
( |
) |
|
|
|
|
|
Nonvested at December 31, 2019 |
|
|
|
|
|
$ |
|
|
RSAs granted to employees under the Omnibus Incentive Plan generally vest over three to
125
TRIUMPH BANCORP, INC. AND SUBSIDIARIES
NOTES TO CONSOLIDATED FINANCIAL STATEMENTS
Restricted Stock Units
A summary of changes in the Company’s nonvested Restricted Stock Units (“RSUs”) under the Omnibus Incentive Plan for the year ended December 31, 2019 were as follows:
|
|
|
|
|
|
|
Weighted Average |
|
|
|
|
|
|
|
|
|
Grant Date |
|
|
|
Nonvested RSUs |
|
Shares |
|
|
Fair Value |
|
||
|
Nonvested at January 1, 2019 |
|
|
|
|
|
$ |
|
|
|
Granted |
|
|
— |
|
|
|
— |
|
|
Vested |
|
|
— |
|
|
|
— |
|
|
Forfeited |
|
|
( |
) |
|
|
|
|
|
Nonvested at December 31, 2019 |
|
|
|
|
|
$ |
|
|
RSUs granted to employees under the Omnibus Incentive Plan vest after
Market Based Performance Stock Units
A summary of changes in the Company’s nonvested Market Based Performance Stock Units (“Market Based PSUs”) under the Omnibus Incentive Plan for the year ended December 31, 2019 were as follows:
|
|
|
|
|
|
|
Weighted Average |
|
|
|
|
|
|
|
|
|
Grant Date |
|
|
|
Nonvested Market Based PSUs |
|
Shares |
|
|
Fair Value |
|
||
|
Nonvested at January 1, 2019 |
|
|
|
|
|
$ |
|
|
|
Granted |
|
|
|
|
|
|
|
|
|
Vested |
|
|
— |
|
|
|
— |
|
|
Forfeited |
|
|
( |
) |
|
|
|
|
|
Nonvested at December 31, 2019 |
|
|
|
|
|
$ |
|
|
Market Based PSUs granted to employees under the Omnibus Incentive Plan vest after
The fair value of the Market Based PSUs granted was determined using the following weighted average assumptions:
|
|
|
Year Ended December 31, |
|
|||||
|
|
|
2019 |
|
|
2018 |
|
||
|
Grant date |
|
|
|
|
|
|
||
|
Performance period |
|
|
|
|
|
|
||
|
Stock price |
|
$ |
|
|
|
$ |
|
|
|
Triumph stock price volatility |
|
|
|
% |
|
|
|
% |
|
Risk-free rate |
|
|
|
% |
|
|
|
% |
Expected volatilities were determined based on the historical volatilities of the Company and the specified peer group. The risk-free interest rate for the performance period was derived from the Treasury constant maturities yield curve on the valuation date.
As of December 31, 2019, there was $
126
TRIUMPH BANCORP, INC. AND SUBSIDIARIES
NOTES TO CONSOLIDATED FINANCIAL STATEMENTS
Performance Based Performance Stock Units
A summary of changes in the Company’s nonvested Performance Based Performance Stock Units (“Performance Based PSUs”) under the Omnibus Incentive Plan for the year ended December 31, 2019 were as follows:
|
|
|
|
|
|
|
Weighted Average |
|
|
|
|
|
|
|
|
|
Grant Date |
|
|
|
Nonvested Performance Based PSUs |
|
Shares |
|
|
Fair Value |
|
||
|
Nonvested at January 1, 2019 |
|
|
— |
|
|
$ |
— |
|
|
Granted |
|
|
|
|
|
|
|
|
|
Vested |
|
|
— |
|
|
|
— |
|
|
Forfeited |
|
|
— |
|
|
|
— |
|
|
Nonvested at December 31, 2019 |
|
|
|
|
|
$ |
|
|
Performance Based PSUs granted to employees under the Omnibus Incentive Plan vest after
Stock Options
A summary of changes in the Company’s stock options under the Omnibus Incentive Plan for the year ended December 31, 2019 were as follows:
|
|
|
|
|
|
|
|
|
|
|
Weighted Average |
|
|
|
|
|
|
|
|
|
|
|
|
|
|
|
|
|
Remaining |
|
|
Aggregate |
|
||
|
|
|
|
|
|
|
Weighted Average |
|
|
Contractual Term |
|
|
Intrinsic Value |
|
|||
|
Stock Options |
|
Shares |
|
|
Exercise Price |
|
|
(In Years) |
|
|
(In Thousands) |
|
||||
|
Outstanding at January 1, 2019 |
|
|
|
|
|
$ |
|
|
|
|
|
|
|
|
|
|
|
Granted |
|
|
|
|
|
|
|
|
|
|
|
|
|
|
|
|
|
Exercised |
|
|
( |
) |
|
|
|
|
|
|
|
|
|
|
|
|
|
Forfeited |
|
|
( |
) |
|
|
|
|
|
|
|
|
|
|
|
|
|
Expired |
|
|
( |
) |
|
|
|
|
|
|
|
|
|
|
|
|
|
Outstanding at December 31, 2019 |
|
|
|
|
|
$ |
|
|
|
|
|
|
|
$ |
|
|
|
|
|
|
|
|
|
|
|
|
|
|
|
|
|
|
|
|
|
Fully vested shares and shares expected to vest at December 31, 2019 |
|
|
|
|
|
$ |
|
|
|
|
|
|
|
$ |
|
|
|
|
|
|
|
|
|
|
|
|
|
|
|
|
|
|
|
|
|
Shares exercisable at December 31, 2019 |
|
|
|
|
|
$ |
|
|
|
|
|
|
|
$ |
|
|
Information related to the stock options for the years ended December 31, 2019, 2018 and 2017 was as follows:
|
|
|
Year Ended December 31, |
|
|||||||||
|
(Dollars in thousands, except per share amounts) |
|
2019 |
|
|
2018 |
|
|
2017 |
|
|||
|
Aggregate intrinsic value of options exercised |
|
$ |
|
|
|
$ |
|
|
|
$ |
|
|
|
Cash received from option exercises |
|
$ |
— |
|
|
$ |
— |
|
|
$ |
|
|
|
Tax benefit realized from option exercises |
|
$ |
|
|
|
$ |
|
|
|
$ |
|
|
|
Weighted average fair value of options granted (per share) |
|
$ |
|
|
|
$ |
|
|
|
$ |
|
|
|
Fair value of vested awards |
|
$ |
|
|
|
$ |
|
|
|
$ |
|
|
Stock options awarded to employees under the Omnibus Incentive Plan are generally granted with an exercise price equal to the market price of the Company’s common stock at the date of grant, vest over
127
TRIUMPH BANCORP, INC. AND SUBSIDIARIES
NOTES TO CONSOLIDATED FINANCIAL STATEMENTS
The fair value of the stock options granted was determined using the following weighted average assumptions:
|
|
|
2019 |
|
|
2018 |
|
|
2017 |
|
|||
|
Risk-free interest rate |
|
|
|
% |
|
|
|
% |
|
|
|
% |
|
Expected term |
|
|
|
|
|
|
|
|
|
|||
|
Expected stock price volatility |
|
|
|
% |
|
|
|
% |
|
|
|
% |
|
Dividend yield |
|
|
— |
|
|
|
— |
|
|
|
— |
|
Expected volatilities were determined based on a blend of the Company’s historical volatility and historical volatilities of a peer group of companies with a similar size, industry, stage of life cycle, and capital structure. The expected term of the options granted was determined based on the SEC simplified method, which calculates the expected term as the mid-point between the weighted average time to vesting and the contractual term. The risk-free interest rate for the expected term of the options was derived from the Treasury constant maturity yield curve on the valuation date.
As of December 31, 2019, there was $
Employee Stock Purchase Plan
During the year ended December 31, 2019, the Company’s Board of Directors adopted, and the Company’s stockholders approved, the Triumph Bancorp, Inc. 2019 Employee Stock Purchase Plan (“ESPP”). Under the ESPP,
NOTE 21 — PARENT COMPANY ONLY CONDENSED FINANCIAL INFORMATION
The following tables present parent company only condensed financial information.
Condensed Parent Company Only Balance Sheets:
|
|
|
December 31, |
|
|
December 31, |
|
||
|
(Dollars in thousands) |
|
2019 |
|
|
2018 |
|
||
|
ASSETS |
|
|
|
|
|
|
|
|
|
Cash and cash equivalents |
|
$ |
|
|
|
$ |
|
|
|
Securities - held to maturity |
|
|
|
|
|
|
|
|
|
Loans |
|
|
|
|
|
|
|
|
|
Investment in bank subsidiary |
|
|
|
|
|
|
|
|
|
Investment in non-bank subsidiaries |
|
|
|
|
|
|
|
|
|
Other assets |
|
|
|
|
|
|
|
|
|
Total assets |
|
$ |
|
|
|
$ |
|
|
|
LIABILITIES AND EQUITY |
|
|
|
|
|
|
|
|
|
Subordinated notes |
|
$ |
|
|
|
$ |
|
|
|
Junior subordinated debentures |
|
|
|
|
|
|
|
|
|
Intercompany payables |
|
|
|
|
|
|
|
|
|
Accrued expenses and other liabilities |
|
|
|
|
|
|
|
|
|
Total liabilities |
|
|
|
|
|
|
|
|
|
Stockholders' equity |
|
|
|
|
|
|
|
|
|
Total liabilities and equity |
|
$ |
|
|
|
$ |
|
|
128
TRIUMPH BANCORP, INC. AND SUBSIDIARIES
NOTES TO CONSOLIDATED FINANCIAL STATEMENTS
Condensed Parent Company Only Statements of Income:
|
|
|
Years Ended December 31, |
|
|||||||||
|
(Dollars in thousands) |
|
2019 |
|
|
2018 |
|
|
2017 |
|
|||
|
Interest income |
|
$ |
|
|
|
$ |
|
|
|
$ |
|
|
|
Interest expense |
|
|
( |
) |
|
|
( |
) |
|
|
( |
) |
|
Provision for loan losses |
|
|
|
|
|
|
|
|
|
|
( |
) |
|
Gain on sale of subsidiary or division |
|
|
— |
|
|
|
— |
|
|
|
|
|
|
Other income |
|
|
( |
) |
|
|
|
|
|
|
|
|
|
Salaries and employee benefits expense |
|
|
( |
) |
|
|
( |
) |
|
|
( |
) |
|
Other expense |
|
|
( |
) |
|
|
( |
) |
|
|
( |
) |
|
Income (loss) before income tax and income from subsidiaries |
|
|
( |
) |
|
|
( |
) |
|
|
|
|
|
Income tax (expense) benefit |
|
|
|
|
|
|
|
|
|
|
( |
) |
|
Dividends from subsidiaries and equity in undistributed subsidiary income |
|
|
|
|
|
|
|
|
|
|
|
|
|
Net income |
|
|
|
|
|
|
|
|
|
|
|
|
|
Dividends on preferred stock |
|
|
— |
|
|
|
( |
) |
|
|
( |
) |
|
Net income available to common stockholders(1) |
|
$ |
|
|
|
$ |
|
|
|
$ |
|
|
|
Comprehensive income attributable to Parent |
|
$ |
|
|
|
$ |
|
|
|
$ |
|
|
Condensed Parent Company Only Statements of Cash Flows:
|
|
|
Years Ended December 31, |
|
|||||||||
|
(Dollars in thousands) |
|
2019 |
|
|
2018 |
|
|
2017 |
|
|||
|
Cash flows from operating activities: |
|
|
|
|
|
|
|
|
|
|
|
|
|
Net income |
|
$ |
|
|
|
$ |
|
|
|
$ |
|
|
|
Adjustments to reconcile net income to net cash provided by (used in) operating activities: |
|
|
|
|
|
|
|
|
|
|
|
|
|
Equity in undistributed subsidiary income |
|
|
( |
) |
|
|
( |
) |
|
|
( |
) |
|
Net accretion of securities |
|
|
( |
) |
|
|
( |
) |
|
|
( |
) |
|
Amortization of junior subordinated debentures |
|
|
|
|
|
|
|
|
|
|
|
|
|
Amortization of subordinated notes issuance costs |
|
|
|
|
|
|
|
|
|
|
|
|
|
Stock based compensation |
|
|
|
|
|
|
|
|
|
|
|
|
|
Income from CLO warehouse investments |
|
|
— |
|
|
|
— |
|
|
|
( |
) |
|
Change in other assets |
|
|
|
|
|
|
|
|
|
|
|
|
|
Change in accrued expenses and other liabilities |
|
|
( |
) |
|
|
( |
) |
|
|
|
|
|
Net cash provided by (used in) operating activities |
|
|
|
|
|
|
( |
) |
|
|
|
|
|
Cash flows from investing activities: |
|
|
|
|
|
|
|
|
|
|
|
|
|
Investment in subsidiaries |
|
|
— |
|
|
|
( |
) |
|
|
( |
) |
|
Purchases of securities held to maturity |
|
|
— |
|
|
|
— |
|
|
|
( |
) |
|
Proceeds from maturities, calls, and pay downs of securities held to maturity |
|
|
|
|
|
|
|
|
|
|
|
|
|
Net change in loans |
|
|
|
|
|
|
|
|
|
|
( |
) |
|
Net cash paid for CLO warehouse investments |
|
|
— |
|
|
|
— |
|
|
|
( |
) |
|
Net proceeds from CLO warehouse investments |
|
|
— |
|
|
|
— |
|
|
|
|
|
|
Cash used in acquisition of subsidiaries, net |
|
|
— |
|
|
|
( |
) |
|
|
( |
) |
|
Net cash provided by (used in) investing activities |
|
|
|
|
|
|
( |
) |
|
|
( |
) |
|
Cash flows from financing activities: |
|
|
|
|
|
|
|
|
|
|
|
|
|
Proceeds from issuance of subordinated notes, net |
|
|
|
|
|
|
— |
|
|
|
— |
|
|
Issuance of common stock, net of issuance costs |
|
|
— |
|
|
|
|
|
|
|
|
|
|
Dividends on preferred stock |
|
|
— |
|
|
|
( |
) |
|
|
( |
) |
|
Purchase of treasury stock |
|
|
( |
) |
|
|
( |
) |
|
|
( |
) |
|
Stock option exercises |
|
|
— |
|
|
|
( |
) |
|
|
|
|
|
Net cash provided by (used in) financing activities |
|
|
( |
) |
|
|
|
|
|
|
|
|
|
Net increase (decrease) in cash and cash equivalents |
|
|
|
|
|
|
( |
) |
|
|
|
|
|
Cash and cash equivalents at beginning of period |
|
|
|
|
|
|
|
|
|
|
|
|
|
Cash and cash equivalents at end of period |
|
$ |
|
|
|
$ |
|
|
|
$ |
|
|
129
TRIUMPH BANCORP, INC. AND SUBSIDIARIES
NOTES TO CONSOLIDATED FINANCIAL STATEMENTS
|
(1) |
During the year ended December 31, 2016, a loss was recorded by the parent company as the result of an intercompany sale of loans to its subsidiary, TBK Bank, at the loans’ fair value. The discount on the purchase of the loans recorded by TBK Bank was fully amortized during the year ended December 31, 2017. The parent company loss on sale of the loans and the TBK Bank discount were eliminated in consolidation. The following table presents a reconciliation of parent company net income available to common stockholders to consolidated net income available to common stockholders: |
|
|
|
Year Ended December 31, |
|
|||||||||
|
(Dollars in thousands) |
|
2019 |
|
|
2018 |
|
|
2017 |
|
|||
|
Parent company net income available to common stockholders |
|
$ |
|
|
|
$ |
|
|
|
$ |
|
|
|
Parent company loss on intercompany sale of loans |
|
|
— |
|
|
|
— |
|
|
|
— |
|
|
TBK Bank discount accretion |
|
|
— |
|
|
|
— |
|
|
|
( |
) |
|
Consolidated net income available to common stockholders |
|
$ |
|
|
|
$ |
|
|
|
$ |
|
|
NOTE 22 — EARNINGS PER SHARE
The factors used in the earnings per share computation follow:
|
|
|
Years Ended December 31, |
|
|||||||||
|
(Dollars in thousands) |
|
2019 |
|
|
2018 |
|
|
2017 |
|
|||
|
Basic |
|
|
|
|
|
|
|
|
|
|
|
|
|
Net income to common stockholders |
|
$ |
|
|
|
$ |
|
|
|
$ |
|
|
|
Weighted average common shares outstanding |
|
|
|
|
|
|
|
|
|
|
|
|
|
Basic earnings per common share |
|
$ |
|
|
|
$ |
|
|
|
$ |
|
|
|
|
|
|
|
|
|
|
|
|
|
|
|
|
|
Diluted |
|
|
|
|
|
|
|
|
|
|
|
|
|
Net income to common stockholders |
|
$ |
|
|
|
$ |
|
|
|
$ |
|
|
|
Dilutive effect of preferred stock |
|
|
— |
|
|
|
|
|
|
|
|
|
|
Net income to common stockholders - diluted |
|
$ |
|
|
|
$ |
|
|
|
$ |
|
|
|
Weighted average common shares outstanding |
|
|
|
|
|
|
|
|
|
|
|
|
|
Dilutive effects of: |
|
|
|
|
|
|
|
|
|
|
|
|
|
Assumed conversion of Preferred A |
|
|
— |
|
|
|
|
|
|
|
|
|
|
Assumed conversion of Preferred B |
|
|
— |
|
|
|
|
|
|
|
|
|
|
Assumed exercises of stock warrants |
|
|
— |
|
|
|
— |
|
|
|
|
|
|
Assumed exercises of stock options |
|
|
|
|
|
|
|
|
|
|
|
|
|
Restricted stock awards |
|
|
|
|
|
|
|
|
|
|
|
|
|
Restricted stock units |
|
|
|
|
|
|
|
|
|
|
— |
|
|
Performance stock units - market based |
|
|
|
|
|
|
— |
|
|
|
— |
|
|
Performance stock units - performance based |
|
|
— |
|
|
|
— |
|
|
|
— |
|
|
Average shares and dilutive potential common shares |
|
|
|
|
|
|
|
|
|
|
|
|
|
Diluted earnings per common share |
|
$ |
|
|
|
$ |
|
|
|
$ |
|
|
Shares that were not considered in computing diluted earnings per common share because they were antidilutive are as follows:
|
|
|
Years Ended December 31, |
|
|||||||||
|
|
|
2019 |
|
|
2018 |
|
|
2017 |
|
|||
|
Assumed conversion of Preferred A |
|
|
— |
|
|
|
— |
|
|
|
— |
|
|
Assumed conversion of Preferred B |
|
|
— |
|
|
|
— |
|
|
|
— |
|
|
Stock options |
|
|
|
|
|
|
|
|
|
|
|
|
|
Restricted stock awards |
|
|
— |
|
|
|
— |
|
|
|
— |
|
|
Restricted stock units |
|
|
— |
|
|
|
— |
|
|
|
— |
|
|
Performance stock units - market based |
|
|
|
|
|
|
|
|
|
|
— |
|
|
Performance stock units - performance based |
|
|
|
|
|
|
— |
|
|
|
— |
|
130
TRIUMPH BANCORP, INC. AND SUBSIDIARIES
NOTES TO CONSOLIDATED FINANCIAL STATEMENTS
NOTE 23 — BUSINESS SEGMENT INFORMATION
The following presents the Company’s operating segments. The accounting policies of the segments are the same as those described in Note 1 – Summary of Significant Accounting Policies. Transactions between segments consist primarily of borrowed funds. Beginning in 2019, intersegment interest expense is allocated to the Factoring segment based on Federal Home Loan Bank advance rates. Prior to 2019, intersegment interest was calculated based on the Company’s prime rate. The provision for loan loss is allocated based on the segment’s ALLL determination. Noninterest income and expense directly attributable to a segment are assigned to it. Taxes are paid on a consolidated basis but not allocated for segment purposes. The Factoring segment includes only factoring originated by TBC. General factoring services not originated through TBC are included in the Banking segment. On March 31, 2017, the Company sold its
|
(Dollars in thousands) |
|
|
|
|
|
|
|
|
|
|
|
|
|
|
|
|
|
Year Ended December 31, 2019 |
|
Banking |
|
|
Factoring |
|
|
Corporate |
|
|
Consolidated |
|
||||
|
Total interest income |
|
$ |
|
|
|
$ |
|
|
|
$ |
|
|
|
$ |
|
|
|
Intersegment interest allocations |
|
|
|
|
|
|
( |
) |
|
|
— |
|
|
|
— |
|
|
Total interest expense |
|
|
|
|
|
|
— |
|
|
|
|
|
|
|
|
|
|
Net interest income (expense) |
|
|
|
|
|
|
|
|
|
|
( |
) |
|
|
|
|
|
Provision for loan losses |
|
|
|
|
|
|
|
|
|
|
( |
) |
|
|
|
|
|
Net interest income (expense) after provision |
|
|
|
|
|
|
|
|
|
|
( |
) |
|
|
|
|
|
Noninterest income |
|
|
|
|
|
|
|
|
|
|
( |
) |
|
|
|
|
|
Noninterest expense |
|
|
|
|
|
|
|
|
|
|
|
|
|
|
|
|
|
Operating income (loss) |
|
$ |
|
|
|
$ |
|
|
|
$ |
( |
) |
|
$ |
|
|
|
(Dollars in thousands) |
|
|
|
|
|
|
|
|
|
|
|
|
|
|
|
|
|
Year Ended December 31, 2018 |
|
Banking |
|
|
Factoring |
|
|
Corporate |
|
|
Consolidated |
|
||||
|
Total interest income |
|
$ |
|
|
|
$ |
|
|
|
$ |
|
|
|
$ |
|
|
|
Intersegment interest allocations |
|
|
|
|
|
|
( |
) |
|
|
— |
|
|
|
— |
|
|
Total interest expense |
|
|
|
|
|
|
— |
|
|
|
|
|
|
|
|
|
|
Net interest income (expense) |
|
|
|
|
|
|
|
|
|
|
( |
) |
|
|
|
|
|
Provision for loan losses |
|
|
|
|
|
|
|
|
|
|
( |
) |
|
|
|
|
|
Net interest income (expense) after provision |
|
|
|
|
|
|
|
|
|
|
( |
) |
|
|
|
|
|
Gain on sale of subsidiary or division |
|
|
|
|
|
|
— |
|
|
|
— |
|
|
|
|
|
|
Other noninterest income |
|
|
|
|
|
|
|
|
|
|
|
|
|
|
|
|
|
Noninterest expense |
|
|
|
|
|
|
|
|
|
|
|
|
|
|
|
|
|
Operating income (loss) |
|
$ |
|
|
|
$ |
|
|
|
$ |
( |
) |
|
$ |
|
|
|
(Dollars in thousands) |
|
|
|
|
|
|
|
|
|
|
|
|
|
|
|
|
|
Year Ended December 31, 2017 |
|
Banking |
|
|
Factoring |
|
|
Corporate |
|
|
Consolidated |
|
||||
|
Total interest income |
|
$ |
|
|
|
$ |
|
|
|
$ |
|
|
|
$ |
|
|
|
Intersegment interest allocations |
|
|
|
|
|
|
( |
) |
|
|
— |
|
|
|
— |
|
|
Total interest expense |
|
|
|
|
|
|
— |
|
|
|
|
|
|
|
|
|
|
Net interest income (expense) |
|
|
|
|
|
|
|
|
|
|
( |
) |
|
|
|
|
|
Provision for loan losses |
|
|
|
|
|
|
|
|
|
|
|
|
|
|
|
|
|
Net interest income (expense) after provision |
|
|
|
|
|
|
|
|
|
|
( |
) |
|
|
|
|
|
Gain on sale of subsidiary or division |
|
|
— |
|
|
|
— |
|
|
|
|
|
|
|
|
|
|
Other noninterest income |
|
|
|
|
|
|
|
|
|
|
|
|
|
|
|
|
|
Noninterest expense |
|
|
|
|
|
|
|
|
|
|
|
|
|
|
|
|
|
Operating income (loss) |
|
$ |
|
|
|
$ |
|
|
|
$ |
|
|
|
$ |
|
|
131
TRIUMPH BANCORP, INC. AND SUBSIDIARIES
NOTES TO CONSOLIDATED FINANCIAL STATEMENTS
|
(Dollars in thousands) |
|
|
|
|
|
|
|
|
|
|
|
|
|
|
|
|
|
|
|
|
|
December 31, 2019 |
|
Banking |
|
|
Factoring |
|
|
Corporate |
|
|
Eliminations |
|
|
Consolidated |
|
|||||
|
Total assets |
|
$ |
|
|
|
$ |
|
|
|
$ |
|
|
|
$ |
( |
) |
|
$ |
|
|
|
Gross loans held for investment |
|
$ |
|
|
|
$ |
|
|
|
$ |
|
|
|
$ |
( |
) |
|
$ |
|
|
|
|
|
|
|
|
|
|
|
|
|
|
|
|
|
|
|
|
|
|
|
|
|
(Dollars in thousands) |
|
|
|
|
|
|
|
|
|
|
|
|
|
|
|
|
|
|
|
|
|
December 31, 2018 |
|
Banking |
|
|
Factoring |
|
|
Corporate |
|
|
Eliminations |
|
|
Consolidated |
|
|||||
|
Total assets |
|
$ |
|
|
|
$ |
|
|
|
$ |
|
|
|
$ |
( |
) |
|
$ |
|
|
|
Gross loans held for investment |
|
$ |
|
|
|
$ |
|
|
|
$ |
|
|
|
$ |
( |
) |
|
$ |
|
|
NOTE 24 — QUARTERLY FINANCIAL DATA (UNAUDITED)
The following presents quarterly financial data for the years ended December 31, 2019 and 2018.
|
|
|
Year Ended December 31, 2019 |
|
|||||||||||||
|
|
|
Fourth |
|
|
Third |
|
|
Second |
|
|
First |
|
||||
|
(Dollars in thousands) |
|
Quarter |
|
|
Quarter |
|
|
Quarter |
|
|
Quarter |
|
||||
|
Interest income |
|
$ |
|
|
|
$ |
|
|
|
$ |
|
|
|
$ |
|
|
|
Interest expense |
|
|
|
|
|
|
|
|
|
|
|
|
|
|
|
|
|
Net interest income |
|
|
|
|
|
|
|
|
|
|
|
|
|
|
|
|
|
Provision for loan losses |
|
|
|
|
|
|
|
|
|
|
|
|
|
|
|
|
|
Net interest income after provision |
|
|
|
|
|
|
|
|
|
|
|
|
|
|
|
|
|
Noninterest income |
|
|
|
|
|
|
|
|
|
|
|
|
|
|
|
|
|
Noninterest expense |
|
|
|
|
|
|
|
|
|
|
|
|
|
|
|
|
|
Net income before income taxes |
|
|
|
|
|
|
|
|
|
|
|
|
|
|
|
|
|
Income tax expense |
|
|
|
|
|
|
|
|
|
|
|
|
|
|
|
|
|
Net income |
|
|
|
|
|
|
|
|
|
|
|
|
|
|
|
|
|
Dividends on preferred stock |
|
|
— |
|
|
|
— |
|
|
|
— |
|
|
|
— |
|
|
Net income available to common stockholders |
|
$ |
|
|
|
$ |
|
|
|
$ |
|
|
|
$ |
|
|
|
Earnings per common share |
|
|
|
|
|
|
|
|
|
|
|
|
|
|
|
|
|
Basic |
|
$ |
|
|
|
$ |
|
|
|
$ |
|
|
|
$ |
|
|
|
Diluted |
|
$ |
|
|
|
$ |
|
|
|
$ |
|
|
|
$ |
|
|
|
|
|
|
|
|
|
|
|
|
|
|
|
|
|
|
|
|
|
|
|
Year Ended December 31, 2018 |
|
|||||||||||||
|
|
|
Fourth |
|
|
Third |
|
|
Second |
|
|
First |
|
||||
|
(Dollars in thousands) |
|
Quarter |
|
|
Quarter |
|
|
Quarter |
|
|
Quarter |
|
||||
|
Interest income |
|
$ |
|
|
|
$ |
|
|
|
$ |
|
|
|
$ |
|
|
|
Interest expense |
|
|
|
|
|
|
|
|
|
|
|
|
|
|
|
|
|
Net interest income |
|
|
|
|
|
|
|
|
|
|
|
|
|
|
|
|
|
Provision for loan losses |
|
|
|
|
|
|
|
|
|
|
|
|
|
|
|
|
|
Net interest income after provision |
|
|
|
|
|
|
|
|
|
|
|
|
|
|
|
|
|
Gain on sale of subsidiary |
|
|
— |
|
|
|
— |
|
|
|
— |
|
|
|
|
|
|
Other noninterest income |
|
|
|
|
|
|
|
|
|
|
|
|
|
|
|
|
|
Noninterest income |
|
|
|
|
|
|
|
|
|
|
|
|
|
|
|
|
|
Noninterest expense |
|
|
|
|
|
|
|
|
|
|
|
|
|
|
|
|
|
Net income before income taxes |
|
|
|
|
|
|
|
|
|
|
|
|
|
|
|
|
|
Income tax expense |
|
|
|
|
|
|
|
|
|
|
|
|
|
|
|
|
|
Net income |
|
|
|
|
|
|
|
|
|
|
|
|
|
|
|
|
|
Dividends on preferred stock |
|
|
— |
|
|
|
( |
) |
|
|
( |
) |
|
|
( |
) |
|
Net income available to common stockholders |
|
$ |
|
|
|
$ |
|
|
|
$ |
|
|
|
$ |
|
|
|
Earnings per common share |
|
|
|
|
|
|
|
|
|
|
|
|
|
|
|
|
|
Basic |
|
$ |
|
|
|
$ |
|
|
|
$ |
|
|
|
$ |
|
|
|
Diluted |
|
$ |
|
|
|
$ |
|
|
|
$ |
|
|
|
$ |
|
|
132
ITEM 9. CHANGES IN AND DISAGREEMENTS WITH ACCOUNTANTS ON ACCOUNTING AND FINANCIAL DISCLOSURE.
None.
ITEM 9A. CONTROLS AND PROCEDURES.
Disclosure Controls and Procedures
As of the end of the period covered by this Annual Report on Form 10-K, the Company carried out an evaluation, under the supervision and with the participation of its management, including its Chief Executive Officer and Chief Financial Officer, of the effectiveness of the design and operation of its disclosure controls and procedures. In designing and evaluating the disclosure controls and procedures, management recognizes that any controls and procedures, no matter how well designed and operated, can provide only reasonable assurance of achieving the desired control objectives, and management was required to apply judgment in evaluating its controls and procedures. Based on this evaluation, the Company’s Chief Executive Officer and Chief Financial Officer concluded that the Company’s disclosure controls and procedures (as defined in Rules 13a-15(e) and 15d-15(e) under the Exchange Act) were effective as of the end of the period covered by this report.
Changes in Internal Control Over Financial Reporting
There were no changes in the Company’s internal control over financial reporting (as defined in Rules 13a-15(f) and 15d-15(f) under the Exchange Act) that occurred during the quarter ended December 31, 2019, that have materially affected, or are reasonably likely to materially affect, the Company’s internal control over financial reporting.
Report on Management’s Assessment of Internal Control Over Financial Reporting
Management of the Company is responsible for establishing and maintaining adequate internal control over financial reporting (as defined in Rules 13a-15(e) and 15d-15(e) under the Exchange Act). The Company’s internal control system is a process designed to provide reasonable assurance regarding the preparation and fair presentation of published financial statements in accordance with GAAP. All internal control systems, no matter how well designed, have inherent limitations and can only provide reasonable assurance with respect to financial reporting.
As of December 31, 2019, management assessed the effectiveness of the Company’s internal control over financial reporting based on the criteria for effective internal control over financial reporting established in “Internal Control-Integrated Framework,” issued by the Committee of Sponsoring Organizations of the Treadway Commission in 2013. Based on the assessment, management determined that the Company maintained effective internal control over financial reporting as of December 31, 2019.
Crowe LLP, the independent registered public accounting firm that audited the consolidated financial statements of the Company included in this Annual Report on Form 10-K, has issued an attestation report on the Company’s internal control over financial reporting as of December 31, 2019. Their report is included in Part IV, Item 15. Exhibits, Financial Statement Schedules under the heading “Report of Independent Registered Public Accounting Firm.”
ITEM 9B. OTHER INFORMATION.
None.
133
PART III
ITEM 10. DIRECTORS, EXECUTIVE OFFICERS, AND CORPORATE GOVERNANCE.
The information called for by this Item will be contained in our definitive Proxy Statement for our 2020 Annual Meeting of Stockholders, and is incorporated herein by reference.
ITEM 11. EXECUTIVE COMPENSATION.
The information called for by this Item will be contained in our definitive Proxy Statement for our 2020 Annual Meeting of Stockholders, and is incorporated herein by reference.
ITEM 12. SECURITY OWNERSHIP OF CERTAIN BENEFICIAL OWNERS AND MANAGEMENT AND RELATED STOCKHOLDER MATTERS.
The information called for by this Item will be contained in our definitive Proxy Statement for our 2020 Annual Meeting of Stockholders, and is incorporated herein by reference.
ITEM 13. CERTAIN RELATIONSHIPS AND RELATED TRANSACTIONS, AND DIRECTOR INDEPENDENCE.
The information called for by this Item will be contained in our definitive Proxy Statement for our 2020 Annual Meeting of Stockholders, and is incorporated herein by reference.
ITEM 14. PRINCIPAL ACCOUNTING FEES AND SERVICES.
The information called for by this Item will be contained in our definitive Proxy Statement for our 2020 Annual Meeting of Stockholders, and is incorporated herein by reference.
134
PART IV
ITEM 15. EXHIBITS, FINANCIAL STATEMENT SCHEDULES.
(a) Documents filed as part of this Report.
1., 2.Financial Statements and Schedules
The following financial statements of Triumph Bancorp, Inc., incorporated herein by reference to Item 8, Financial Statements and Supplementary Data:
|
|
• |
Report of Independent Registered Public Accounting Firm |
|
|
• |
Consolidated Balance Sheets as of December 31, 2019 and 2018 |
|
|
• |
Consolidated Statements of Income for the Years Ended December 31, 2019, 2018, and 2017 |
|
|
• |
Consolidated Statements of Comprehensive Income for the Years Ended December 31, 2019, 2018, and 2017 |
|
|
• |
Consolidated Statements of Changes in Equity for the Years Ended December 31, 2019, 2018, and 2017 |
|
|
• |
Consolidated Statements of Cash Flows for the Years Ended December 31, 2019, 2018, and 2017 |
|
|
• |
Notes to Consolidated Financial Statements |
Financial statement schedules have been omitted as they are not applicable or the required information is shown in the Consolidated Financial Statements or notes thereto.
|
3. |
|
Exhibits (Exhibits marked with a “†” denote management contracts or compensatory plans or arrangements) |
||||
|
2.1 |
|
|||||
|
2.2 |
|
|||||
|
2.3 |
|
|||||
|
2.4 |
|
|||||
|
2.5 |
|
|||||
|
3.1 |
|
|||||
|
3.2 |
|
|||||
|
3.3 |
|
|||||
|
3.4 |
|
|||||
135
|
3.5 |
|
|||||
|
4.1 |
|
|||||
|
4.2 |
|
|||||
|
4.3 |
|
|||||
|
4.4 |
|
|||||
|
4.5 |
|
|||||
|
|
|
Pursuant to Item 601(b)(4)(iii)(A) of Regulation S-K, the Company has not filed as an exhibit to this Form 10-K certain instruments defining the rights of the holders of certain additional long-term debt of the Company and its subsidiaries, none of which authorize a total amount of indebtedness in excess of 10% of the total assets of the Company and its subsidiaries on a consolidated basis. The Company agrees to furnish a copy of any of these agreements to the SEC upon request. |
||||
|
10.1† |
|
|||||
|
10.2† |
|
|||||
|
10.3† |
|
|||||
|
10.4† |
|
|||||
|
10.5† |
|
|||||
|
10.6† |
|
|||||
|
10.7† |
|
|||||
|
10.8† |
|
|||||
|
10.9† |
|
|||||
|
10.10† |
|
|||||
136
|
10.11† |
|
|||||
|
10.12† |
|
|||||
|
10.13† |
|
|||||
|
10.14† |
|
|||||
|
10.15† |
|
|||||
|
10.16† |
|
|||||
|
10.17† |
|
|||||
|
10.18 |
|
|||||
|
14.1 |
|
|||||
|
21.1 |
|
|||||
|
23.1 |
|
|||||
|
31.1 |
|
|||||
|
31.2 |
|
|||||
|
32.1 |
|
|||||
|
101.INS |
|
Inline XBRL Instance Document (the instance document does not appear in the Interactive Data File because its XBRL tags are embedded within the Inline XBRL document). |
||||
|
101.SCH |
|
Inline XBRL Taxonomy Extension Schema Document. |
||||
|
101.CAL |
|
Inline XBRL Taxonomy Extension Calculation Linkbase Document. |
||||
|
101.DEF |
|
Inline XBRL Taxonomy Extension Definition Linkbase Document. |
||||
|
101.LAB |
|
Inline XBRL Taxonomy Extension Label Linkbase Document. |
||||
|
101.PRE |
|
Inline XBRL Taxonomy Extension Presentation Linkbase Document. |
||||
137
|
104 |
|
Cover Page Interactive Data File (formatted as inline XBRL and contained in Exhibit 101). |
||||
*The schedules have been omitted pursuant to Item 601(b)(2) of Regulation S-K and will be provided to the SEC upon request.
138
SIGNATURES
Pursuant to the requirements of Section 13 or 15(d) of the Securities Exchange Act of 1934, the registrant has duly caused this report to be signed on its behalf by the undersigned, thereunto duly authorized.
|
|
|
|
TRIUMPH BANCORP, INC. |
|
|
|
|
(Registrant) |
|
|
|
|
|
|
Date: |
February 11, 2020 |
|
/s/ Aaron P. Graft |
|
|
|
|
Aaron P. Graft |
|
|
|
|
President and Chief Executive Officer |
|
|
|
|
|
|
Date: |
February 11, 2020 |
|
/s/ R. Bryce Fowler |
|
|
|
|
R. Bryce Fowler |
|
|
|
|
Executive Vice President and Chief Financial Officer |
Pursuant to the requirements of the Securities Exchange Act of 1934, this report has been signed below by the following persons on behalf of the registrant and in the capacities and on the dates indicated.
|
Name |
|
Title |
|
Date |
|
/s/ Aaron P. Graft |
|
Director and President and Chief Executive Officer |
|
February 11, 2020 |
|
Aaron P. Graft |
(Principal Executive Officer) |
|
||
|
/s/ R. Bryce Fowler |
|
Executive Vice President and Chief Financial Officer |
|
February 11, 2020 |
|
R. Bryce Fowler |
(Principal Financial and Accounting Officer) |
|
||
|
/s/ Carlos M. Sepulveda, Jr. |
|
Director and Chairman |
|
February 11, 2020 |
|
Carlos M. Sepulveda, Jr. |
|
|
||
|
/s/ Charles A. Anderson |
|
Director |
|
February 11, 2020 |
|
Charles A. Anderson |
|
|
||
|
/s/ Richard Davis |
|
Director |
|
February 11, 2020 |
|
Richard Davis |
|
|
||
|
/s/ Robert Dobrient |
|
Director |
|
February 11, 2020 |
|
Robert Dobrient |
|
|
||
|
/s/ Douglas M. Kratz |
|
Director |
|
February 11, 2020 |
|
Douglas M. Kratz |
|
|
||
|
/s/ Maribess L. Miller |
|
Director |
|
February 11, 2020 |
|
Maribess L. Miller |
|
|
||
|
/s/ Fred Perpall |
|
Director |
|
February 11, 2020 |
|
Fred Perpall |
|
|
||
|
/s/ Michael P. Rafferty |
|
Director |
|
February 11, 2020 |
|
Michael P. Rafferty |
|
|
||
|
/s/ C. Todd Sparks |
|
Director |
|
February 11, 2020 |
|
C. Todd Sparks |
|
|
||
|
|
|
|
|
|
|
/s/ Justin N. Trail |
|
Director |
|
February 11, 2020 |
|
Justin N. Trail |
|
|
|
|
|
|
|
|
|
|
|
|
|
|
|
|
139