EX-99.1
Published on April 16, 2025

Exhibit 99.1
April 16, 2025
Fellow Shareholders,
For the first quarter, we recorded a net loss to common stockholders of $(0.8) million, or $(0.03) per diluted share. These results include certain non-core expenses totaling just under $3.0 million, partially offset by $0.8 million in non-core gains. Those items negatively impacted EPS by $0.07.
Key Thoughts for the Quarter
Here are a few things I think investors should note for the first quarter:
•We foresaw a quarter like this was possible, even if we hoped against it. Our product strategy, technology roadmap, and building our Network come at an expense. A strong freight market mitigated the bottom-line impact of that investment coming out of Covid. Over three years ago, we watched the downcycle begin and have watched it last longer than anyone expected. In prior letters, I wrote that “the plan is to stick to the plan” despite market headwinds. That has not changed. Now that seasonality and cyclicality have converged with uncertainty around trade policy and recession fears, our enterprise valuation has been affected. We will not blame the freight market and trade policy for our results, nor will we let them dissuade us from our strategic vision. So, what do we do now?
•We continue pursuing the path that creates the greatest long-term value. We have plenty of capital, we have a leading market position, and we have many levers that we can pull. In other words, we have options. We could have deviated from the plan and ceased additional investments, delayed immediate realignment expenses, or cut our way to modest profitability this quarter. Each of those has a cost — whether you execute it or avoid it. It is not in our nature to avoid pain today at the risk of jeopardizing long-term value. Pausing our efforts to further monetize the core transaction could have allowed us to reduce near-term expenses and deploy capital in other ways (including potentially repurchasing our common stock) that might have improved near-term earnings. We see it, we think about it, and we evaluate it as a company. We will make the case in this letter supporting why we have chosen the road we have chosen. In light of that strategic rationale, investors can make informed choices. As you do, bear in mind that neither management nor our board has unlimited patience for investment without improving financial results.
•It’s all about the core transaction. I referenced the core transaction above. The core transaction for our transportation business is the transmission and auditing of data in furtherance of making a payment. Nearly everything we do is tied to that core. This applies to Factoring, Payments, and Intelligence. The only way we can create enduring value is by profiting from the core. I unpack this in detail below, because it is important that investors understand the core transaction and how it feeds the rest of the business.
•Much of the expense for our work on LoadPay and Factoring-as-a-Service (“FaaS”) is reflected in this quarter’s financials, with little revenue to offset it. Delayed gratification is hard. Both products are coming to the end of their limited release periods in the second quarter. We have teams of people that are hard at work adding features and bringing these products to life. I am encouraged by what I am seeing, as I detail below. Revenue won’t flip on like a light switch in the back half of the year, but it should steadily burn brighter.
•Upon the closing and full integration of Greenscreens, we expect to have the most valuable rating product in the market. It is now time to put more of our Intelligence strategy into writing — not all of it for competitive reasons, but much of it. If we were not in the process of acquiring Greenscreens, we would have other options for the deployment of our capital. Is this a good tradeoff? It depends on (i) whether you believe that rating data (e.g., data models and analytics that brokers use to understand the market for hiring truckers and bidding on freight from shippers) is valuable to the market, and (ii) whether you think Triumph is equipped to deliver it at a profitable margin. Investors can do their own research and should quickly understand the answer to (i) is yes. What about (ii)? This is the fundamental thing to understand — our Intelligence offering is built around the core transaction. Because we transmit and audit more data in furtherance of making a payment than anyone, we have the densest and cleanest data set in the market upon which to build rating products. We also have the customer relationships
1
and integrations to expedite our go-to-market strategy. This is why we have gone down this road, and why we intend to see it through.
•Network transactions increased 26.8%. Network transactions grew materially. This was largely driven by integrating C.H. Robinson (the nation's largest freight broker) for payments, RXO (the nation's third largest freight broker) for payments, as well as a large tier one transportation factor into the network.
•Density continues to grow above 50%; revenue growth must follow. Based on growth within the quarter, we calculate our Network engagement[1] at just over 50% of all truckload brokered freight[2]. When you consider the contraction of the overall market, it is likely that it is a higher percentage than 50%. I expect the number will continue to go higher. At this point; however, I do not believe the next dollar of volume matters as much as it once did. We have proven that we can build products and grow density. It is now time to prove that we can grow revenue and profitability behind them.
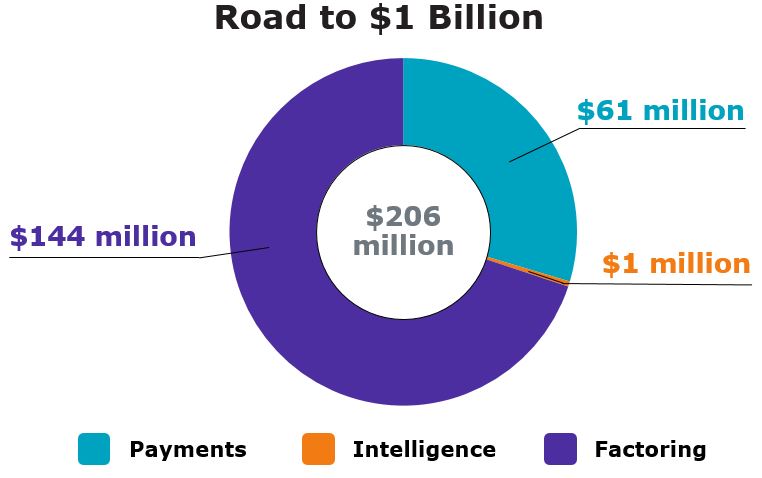
•We are ~21% of the way to our long-term revenue goal for our transportation businesses. Picking up on the revenue growth theme from above: several quarters ago, we staked out a long-term goal of $1 billion of transportation revenue. Investors likely consider that aspirational and will focus on nearer term targets. I understand and am fine with that. My bias is to tell the Street what I tell the team so that my messaging is consistent internally and externally. Investors can set their own benchmarks and targets. What I can tell you is that today, in a very soft market, our annualized transportation revenues are about $206 million. We expect that number will go up from here – not always in a linear fashion, but that it will go up. To be as specific as we can — Q2 could have a lot of noise in it due to M&A, and our financial results will still reflect the limited release of products in development. That means we have to grow revenue and profitability in the back half of the year. We have to do that almost irrespective of market conditions. We understand the mission and we accept it.
Discussion of the Core Transaction & The Symbiotic Value Created From It
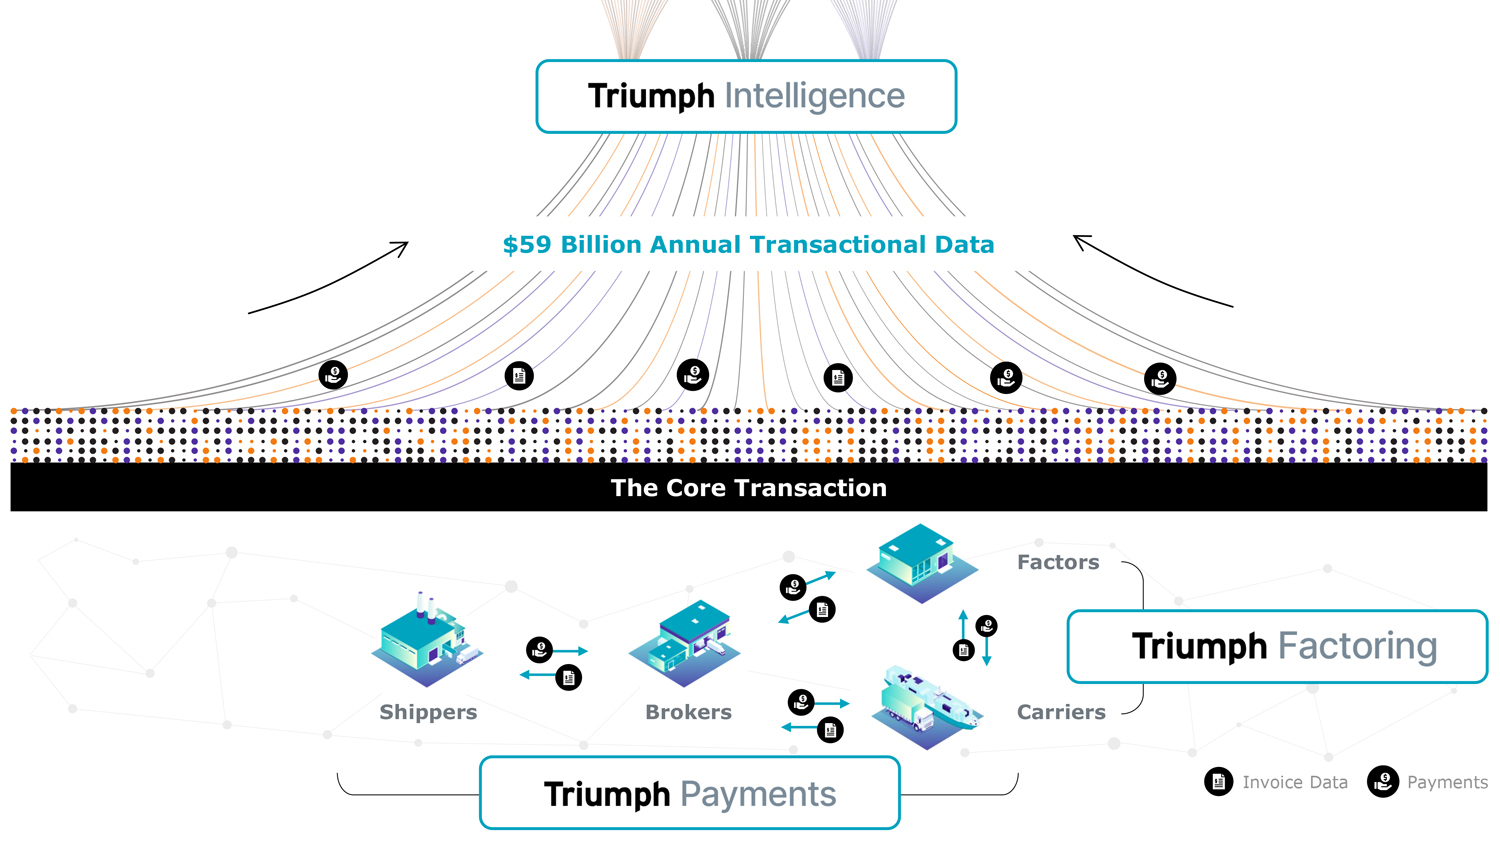
The core transactions of our Network form the foundation for almost all our transportation products. Factoring, auditing, and payments all involve the transmission and auditing of data for the purposes of making a payment. Investors need to understand this to understand the core transaction. Network transactions, which returned to growth this quarter, are a subset of the core transaction. As you can see in the graphic below, the source data from our Payments and Factoring businesses will feed into our Intelligence business. In time, the Intelligence business will also return data for our Payments and Factoring businesses to make them more efficient and reduce the risk of fraud. In that regard, all of our transportation businesses are symbiotic.
2
Going deeper on this symbiotic relationship, when I said last quarter that our Network transactions were not the most valuable thing we would do going forward, I did not mean that we thought they were not valuable or that the Network was not compelling. What I was trying to help our investors understand was that we are developing new ways to monetize that same core transaction through our Intelligence offering. Intelligence has different economics than Network transactions. Intelligence has higher potential margins because we now have a way to create economic value from the data generated by our Network. As a result, we expect to have very little cost of goods sold in our Intelligence offering. The Greenscreens product we are acquiring already has 90% gross margins, and we do not see that varying in the near term. Thus, Network transactions are valuable in isolation, and they are also valuable due to the symbiotic relationship with Intelligence.
I view this as analogous to the symbiotic relationship between Factoring and LoadPay. Factoring has become a mid-teens yielding asset. That revenue is very valuable to Triumph and has been for years. The value does not stop there; however, because the Factoring business is part of the core transaction. It supplements our data set for Intelligence. Finally, Factoring provides a powerful marketing funnel for LoadPay, which accounts for the symbiotic relationship. The interchange revenue we realize in LoadPay is higher per dollar of spend than our discount rate we charge in Factoring. Accordingly, LoadPay is a more efficient business model and generates higher margin revenue. Factoring used to be the most profitable thing we did on a per unit basis. LoadPay should supplant that, and it also supports Factoring by improving the client experience. That doesn’t mean that Factoring is not valuable; it means it is part of a larger suite of products that make Triumph’s future very exciting for all of our stakeholders.
Our Vision in Transportation
We see a world where transactions are secure, accurate and seamless. Triumph is committed to modernizing and simplifying freight transactions, unlocking opportunities and actionable insights inside our Network. Our segments —Factoring, Payments, Intelligence, and Banking — each play a role in enabling this vision. Therefore, later this quarter we will unify our brand and galvanize our assets as one Triumph to better serve the transportation industry. In doing, we seek to streamline how we engage with our customers to eliminate confusion between the Triumph Financial, TriumphPay, and Triumph Factoring brand names.
Note: All values presented are annualized 1Q 2025
Factoring. Factoring is where our transportation journey began. We are the second largest transportation factoring company in the United States and currently generate about $144 million of annualized revenue from the business. With additional scale in a normal freight market, this business should run a 40% operating margin. Reflecting the normal seasonality we saw in 1Q, today it runs 19.2%, but we are not in a normal freight environment. I expect revenue in this segment to at least double on our journey to $1 billion in transportation revenue. I expect that to happen organically,
3
through our FaaS offering, and through opportunistic M&A should something compelling arise. C.H. Robinson ("CHRW") is our first FaaS customer. We expect others to be added later this year. This may include existing factoring companies as well as other large brokers. Brokers have wanted a partner who can give them this ability reliably, and at scale, for a long time. Our service offering allows them to monetize payments to their carriers and own the complete carrier relationship.
Payments. Second is our Payments segment. This business currently generates about $61 million of annualized revenue at a (0.1) % EBITDA margin, impacted by 1Q non-core expense items totaling $1.1 million, or 7.2%. We recognized severance expenses this quarter as we completed a reorganization in this segment. When we started our Payments business six years ago, there was a lot we did not know. The business has grown through the last three years of the worst freight cycle in modern history. The Payments business is all about the Network, which powers all our solutions, expanding the value beyond the payments aspects of what we do.
LoadPay is included in our Payments segment. LoadPay sits at the end of the core transaction and provides the ability to both capture additional float and monetize the same core transaction once the carrier is paid. Generally speaking, we are paying billions of dollars each month on behalf of our payors. The carriers to whom we make these payments are spending that money at fuel stops, on repairs, maintenance, tires, meals, showers, laundry services, and a host of other necessary items in their businesses. We created a digital bank account which allows the carrier to almost instantly receive funds inside our Network giving carriers the ability to manage their funds on the same schedule they manage their business, 24x7x365. We have guided toward revenues of about $750 per year per account. Thus far, nothing is waving us off that guidance. We currently find that for carriers who sweep the money out immediately, we might have run rate revenue of $50 for the year, but some carriers who link their account to Payments or Factoring are trending materially higher than the $750 target. LoadPay will continue with separate branding because it is a customer facing brand that we expect to be used by industry participants other than Triumph.
Intelligence. Finally, we will go to market with our new Intelligence offering and expect to take a ratings and performance product to market later this year following the anticipated closing of our Greenscreens acquisition. We expect this closing to occur in 2Q. Greenscreens is the fastest-growing rate intelligence provider in transportation. We are buying Greenscreens because we believe they have the best technology in the industry. Greenscreens’ core product is its freight-pricing software, which leverages AI/ML tools, and uses data from customer freight transactions to provide data analytics and insights regarding pricing to its customers. We can further empower that product suite with our own data and the data of our customers who wish to use our Intelligence services. When we layer that best-in-class technology onto those data assets, which we believe is the largest and cleanest repository of settled truckload payment data in the U.S., investors can get some idea why our payor clients are excited about the possibilities. Let me be clear (and this is my opinion, of course), Triumph will be producing the most trusted and comprehensive pricing tool in the market. We will be able to demonstrate that clearly and objectively. We have the strategy laid out, and we are laser focused on bringing it to reality post-closing on Greenscreens.
That’s the path forward towards our long-term goal of both our brand promise and our revenue. Vision begets strategy, strategy begets product, product begets density, density begets revenue, revenue begets profits. Vision, strategy, product and density have achieved critical mass. It is now time to demonstrate revenue growth and margin improvement to investors.
Transportation Market Update
The seasonal slowdown delivered as expected in 1Q. During the quarter, fuel costs increased throughout January, leveled off in February, and declined steadily through March while average invoice prices failed to maintain strength. When comparing YoY, the downward trajectory on the average invoice size was more aggressive in 2025, creating greater pressure on contract rates than spot. We have, for the first time in the last three years, experienced a reduction in contract over spot pricing. Contract rates were down 7% while spot rates went down 5%.
It was a quarter with weather issues and pre-tariff activity, all of which generally tended to have some effect on trucking rates. From mid-February through March port activity increased in anticipation of tariffs. Dry van spot rates; however, were stable or declined. Reefer rates held at their seasonal level, while flatbed rates went up almost weekly outside of normal seasonal patterns, possibly related to steel, lumber and large item movements associated with tariff fears. Pressure remains high on small carriers, as medium carriers are seeking contracts with freight brokers, in addition to the usual contracting with shippers, to avoid loads with spot rates that are too tight to break even. The optimism that was reflected for early 2025 last fall has faded. Many asset-based and brokerage industry leaders are finding it difficult to make
4
predictions. To this point, both gross tonnage and number of loads as reported by multiple sources seem steady. It seems unlikely that a recession or reduction of freight volume could do much more damage to freight rates, but anything is possible if truckers are willing to lose money to move freight.
Payments
1.Analysis of financial and operational performance for the quarter
2.Progress and plans related to monetizing the Network
3.LoadPay update
Analysis of financial and operational performance for the quarter. EBITDA margin for the quarter was (0.1)% for our Payments segment. EBITDA margin was impacted by 7.2% due to certain non-core expenses incurred in the segment during the quarter.
| March 31, 2025 | December 31, 2024 | September 30, 2024 | June 30, 2024 | March 31, 2024 | Current Quarter Q/Q | Current Year Y/Y | |||||||||||||||||||||||||||||||||||||||||||||||
| For the Qtr Ending | Change | % Change | Change | % Change | |||||||||||||||||||||||||||||||||||||||||||||||||
| Payments: | |||||||||||||||||||||||||||||||||||||||||||||||||||||
| Invoice Volume | 7,182,044 | 6,788,408 | 6,278,246 | 6,062,779 | 5,717,016 | 393,636 | 5.8 | % | 1,465,028 | 25.6 | % | ||||||||||||||||||||||||||||||||||||||||||
| Payment Volume | $ | 8,777,825,000 | $ | 7,625,735,000 | $ | 7,091,493,000 | $ | 6,687,587,000 | $ | 6,379,680,000 | $ | 1,152,090,000 | 15.1 | % | $ | 2,398,145,000 | 37.6 | % | |||||||||||||||||||||||||||||||||||
| Network Invoice Volume | 719,531 | 567,258 | 661,628 | 701,768 | 621,209 | 152,273 | 26.8 | % | 98,322 | 15.8 | % | ||||||||||||||||||||||||||||||||||||||||||
| Network Payment Volume | $ | 1,167,464,000 | $ | 922,927,000 | $ | 1,063,228,000 | $ | 1,133,118,000 | $ | 1,035,099,000 | $ | 244,537,000 | 26.5 | % | $ | 132,365,000 | 12.8 | % | |||||||||||||||||||||||||||||||||||
| Average Invoice Price | 1,222 | 1,123 | 1,130 | 1,103 | 1,116 | 99 | 8.8 | % | 106 | 9.5 | % | ||||||||||||||||||||||||||||||||||||||||||
| Network Engagement | 50.4 | % | 48.7 | % | 47.8 | % | 46.6 | % | 42.7 | % | 1.7 | % | 3.5 | % | 7.7 | % | 18.0 | % | |||||||||||||||||||||||||||||||||||
| Average Float | $ | 442,901,000 | $ | 410,044,000 | $ | 363,255,000 | $ | 333,888,000 | $ | 330,448,000 | $ | 32,857,000 | 8.0 | % | $ | 112,453,000 | 34.0 | % | |||||||||||||||||||||||||||||||||||
| Fee Revenue | $ | 6,903,000 | $ | 6,704,000 | $ | 6,611,000 | $ | 6,131,000 | $ | 5,808,000 | $ | 199,000 | 3.0 | % | $ | 1,095,000 | 18.9 | % | |||||||||||||||||||||||||||||||||||
| Total Revenue | $ | 15,184,000 | $ | 15,031,000 | $ | 14,873,000 | $ | 13,862,000 | $ | 13,126,000 | $ | 153,000 | 1.0 | % | $ | 2,058,000 | 15.7 | % | |||||||||||||||||||||||||||||||||||
| # of LoadPay Accounts | 778 | 192 | 65 | — | — | 6 | 312.5 | % | 8 | — | % | ||||||||||||||||||||||||||||||||||||||||||
| LoadPay Funding | $ | 4,986,000 | $ | 777,000 | $ | 178,000 | $ | — | $ | — | $ | 4,209,000 | 541.7 | % | $ | 4,986,000 | — | % | |||||||||||||||||||||||||||||||||||
| Average Interchange Fees | 1.76 | % | 1.67 | % | — | % | — | % | — | % | 0.09 | % | 5.39 | % | 1.76 | % | — | % | |||||||||||||||||||||||||||||||||||
| EBITDA margin | (0.1) | % | 8.6 | % | 0.5 | % | (10.4) | % | (13.2) | % | (8.7) | % | (101.2) | % | 13.1 | % | (99.2) | % | |||||||||||||||||||||||||||||||||||
We have achieved our objective of 50% Network engagement in brokered freight and will continue to push volume higher. For the quarter, payment volume increased by 15.1% to $35.1 billion, annualized. Our broker clients represent $31.4 billion of that. Our annualized unique broker audit dollar volume was down slightly from 4Q at $14.2 billion, and our annualized unique factor audit volume was also down at $9.9 billion. The difference between payment volumes going up and audit volumes going down is largely a result of onboarding CHRW as a payments customer. The market was down, but we were up because of client growth.
Progress and plans related to monetizing payments. As I alluded to above, the time has come to shift more emphasis to monetization of the Network. Our efforts to monetize payments will be aimed at fairly and consistently pricing our services based on the value created for our clients as we continue to build volume. The value of our payments services has continued to grow over time with new features, and services available to customers, such as fraud mitigation, and increased visibility to paperwork and payment exceptions to provide faster resolution and improve DSO; however, many of our customers were signed prior to the HubTran acquisition when quickpay was our only source of revenue. Newer customers are paying a per payment fee as well as sharing quickpay revenue. Simply put, the value we are creating for many of our clients has grown faster than our pricing. It is important for us to deliver on our promise of neutrality, and part of that is reflected in pricing consistently and fairly. We remain committed to ensuring that Triumph first delivers meaningful value to our client relationships and that we are then compensated for those investments.
We are enhancing our core payments processes and audit products to mitigate the ever-increasing risk of fraud and working to save our clients more time and effort than ever before. We are pleased with the rollout and market adoption of our NextGen Audit product and our progress on LTL audit in response to client requests. We recognize the importance of
5
continued enhancements to these products to both defend and grow client relationships and the revenues associated with them.
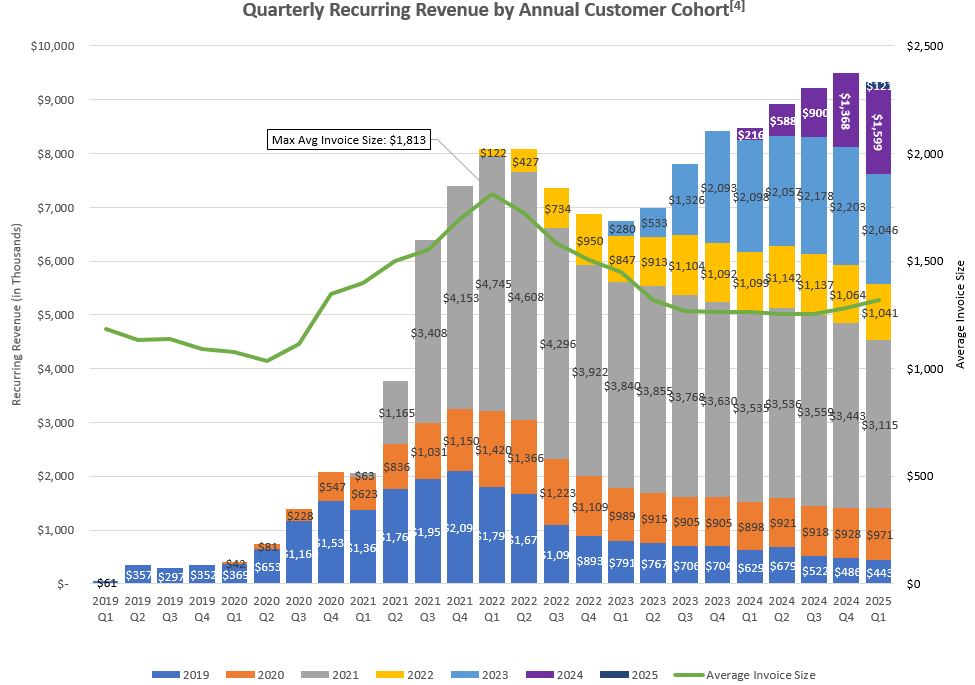
The chart below provides a visual demonstration of how we’ve increased revenue in our Payments segment to date. The line represents invoice sizes[3], while the bars represent revenue. The revenue bars highlight fee income that can be attributed to a specific customer in a specific year and excludes supply chain finance income and float. During the quarter, we added 10 brokers, 4 factors and 7 shippers to the network. We upgraded 9 broker clients and 24 factor clients from our Legacy Audit product to NextGen Audit and we cross-sold 3 brokers (audit to include payments or payments to include audit). Together, this added about $2.4 million in incremental annual revenue.
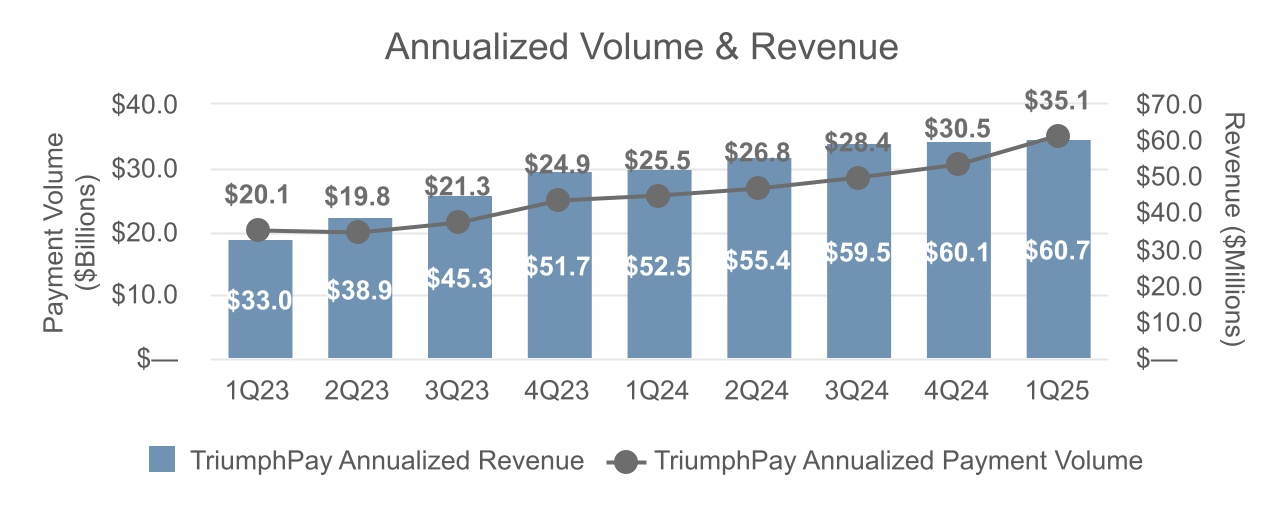
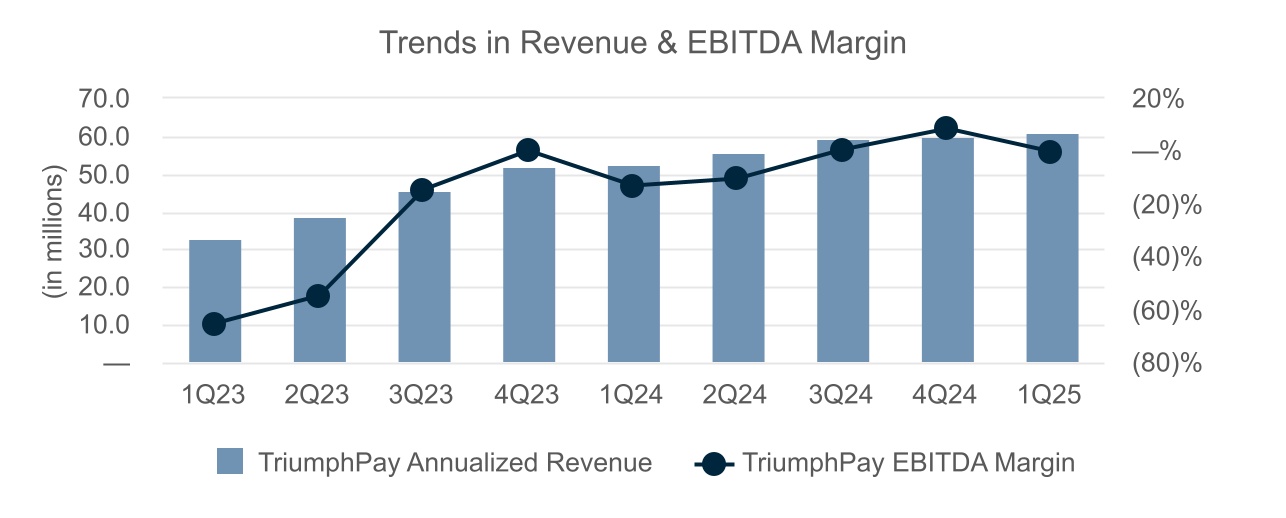
In the chart on the next page, we highlight the continued revenue growth and its trend over the last eight quarters against the backdrop of our payment volumes (note this is payment volume only, not Network engagement). Our first quarter revenue run rate was $60.7 million, annualized. We have generated a roughly 35.6% CAGR in revenue over the last two years.
6
In the chart below, we highlight the trend lines in EBITDA margin relative to revenue. Margin growth is very important to us, and we expect it to continue, although there can be noise in any given quarter as we saw in 1Q where non-core expenses impacted EBITDA margin by 7.2%.
LoadPay Update. Our LoadPay initiative is progressing as expected. We debuted LoadPay in a closed beta last year at Triumph, as well as with CHRW. We have spent the first quarter refining the product and introducing new features so that the first impression for the client is truly compelling, not just for the opportunity to be paid almost instantly by over 400 freight brokers. Carriers can now open a LoadPay account in less than 8 minutes and immediately begin transacting.
We’ve been working closely with CHRW to ensure that the carrier experience with LoadPay is excellent, and they have recently started offering LoadPay along with Factoring Powered by Delta to all carriers who they onboard. We ended 2024 paying about $1.0 million into carriers’ LoadPay accounts. During 1Q, we paid $5.0 million into carriers’ LoadPay accounts inclusive of $3.2 million in March alone. The source of those payments, which are deposits into the non-interest bearing accounts of the carrier customers, were a combination of Triumph Factoring, TriumphPay Select Carriers, and the Factoring Powered by Delta product offered through CHRW as well as ACH payments from non-TriumphPay brokers to carriers. We started the year with 192 LoadPay accounts and reported 216 as of the last shareholder letter. As we have broadened our distribution, we have seen the number of accounts grow to 778 at the end of the quarter, and to 1,013 as of the date of this publishing. We are still early in monetization efforts of the accounts. We continue to expect to finish the year with between 5,000 and 10,000 accounts.
7
Factoring
1.Analysis of financial and operational performance for the quarter
2.Technology and FaaS
3.Factoring segment and revenue growth
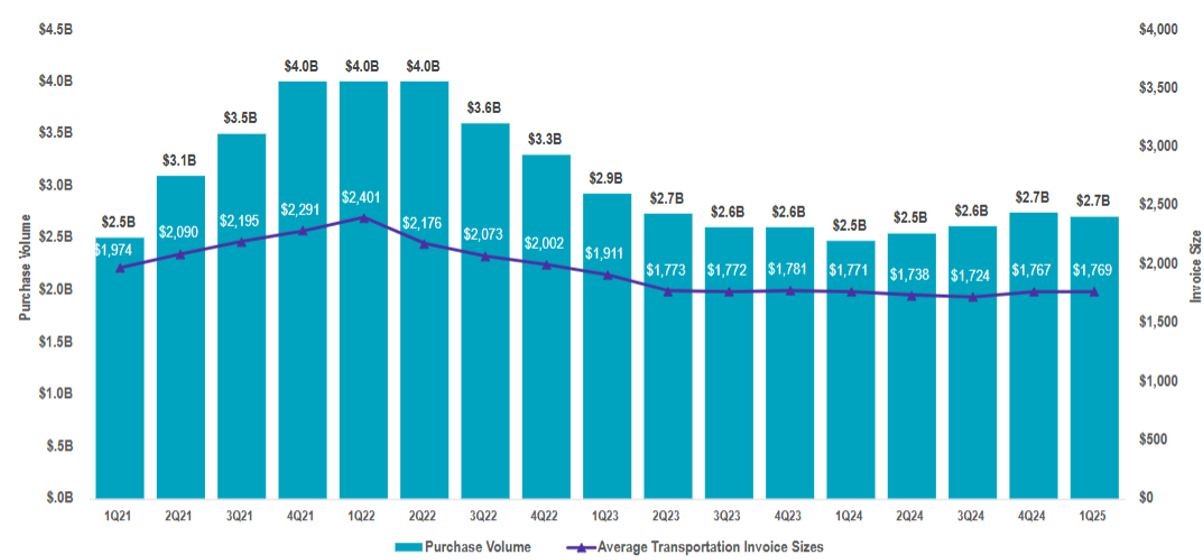
Analysis of financial and operational performance for the quarter. During 1Q, our average transportation invoice price was $1,769. This is $2 higher than 4Q 2024, but $2 lower than the same period in 2024. Purchased volume decreased 1.4% relative to 4Q 2024.
| March 31, 2025 | December 31, 2024 | September 30, 2024 | June 30, 2024 | March 31, 2024 | Current Quarter Q/Q | Current Year Y/Y | |||||||||||||||||||||||||||||||||||||||||||||||
| For the Qtr Ending | Change | % Change | Change | % Change | |||||||||||||||||||||||||||||||||||||||||||||||||
| Factoring: | |||||||||||||||||||||||||||||||||||||||||||||||||||||
| Invoice Volume | 1,497,644 | 1,524,904 | 1,480,824 | 1,432,366 | 1,367,625 | (27,260) | (1.8) | % | 130,019 | 9.5 | % | ||||||||||||||||||||||||||||||||||||||||||
| Purchased Volume | $ | 2,707,805,000 | $ | 2,747,351,000 | $ | 2,610,177,000 | $ | 2,542,327,000 | $ | 2,469,797,000 | $ | (39,546,000) | (1.4) | % | $ | 238,008,000 | 9.6 | % | |||||||||||||||||||||||||||||||||||
| Average Transportation Invoice Size | $ | 1,769 | $ | 1,767 | $ | 1,724 | $ | 1,738 | $ | 1,771 | $ | 2 | 0.1 | % | $ | (2) | (0.1) | % | |||||||||||||||||||||||||||||||||||
| Dry Van Spot Rates | $ | 2.05 | $ | 2.02 | $ | 1.98 | $ | 1.98 | $ | 2.03 | $ | 0.03 | 1.5 | % | $ | 0.02 | 1.0 | % | |||||||||||||||||||||||||||||||||||
| Dept of Energy Diesel Average | $ | 3.62 | $ | 3.53 | $ | 3.70 | $ | 3.86 | $ | 3.96 | $ | 0.09 | 2.5 | % | $ | (0.34) | (8.6) | % | |||||||||||||||||||||||||||||||||||
| Invoices / Client | 204 | 205 | 192 | 180 | 168 | (1) | (0.5) | % | 36 | 21.4 | % | ||||||||||||||||||||||||||||||||||||||||||
| Discount Rate | 1.31 | % | 1.34 | % | 1.40 | % | 1.42 | % | 1.41 | % | (0.03) | % | (2.2) | % | (0.10) | % | (7.1) | % | |||||||||||||||||||||||||||||||||||
| Avg Daily Purchases* | $ | 44,390,000 | $ | 43,609,000 | $ | 40,784,000 | $ | 40,354,000 | $ | 39,203,000 | 781,000 | 1.8 | % | 5,187,000 | 13.2 | % | |||||||||||||||||||||||||||||||||||||
| Operating margin | 19.24 | % | 23.67 | % | 20.99 | % | 12.48 | % | 19.48 | % | (4.43) | % | (18.7) | % | (0.24) | % | (1.2) | % | |||||||||||||||||||||||||||||||||||
*calculated using number of working days
Factoring segment operating income was $6.9 million, or $2.1 million lower than the prior quarter. This was primarily due to normal 1Q seasonal softness and year-end salary related resets. Total revenue shrank 5.9% as seasonal trends throughout most of the quarter impacted the volume of activity. The yield on average receivables balances was down, falling 0.61% to 12.75% due to a lower average discount rate in the quarter caused by a mix shift towards larger fleets and A/R turn increasing by two days over the same period.
Technology and FaaS. As we continue to build the most valuable factoring platform in the industry, our focus remains on leveraging technology to enhance every aspect of the client experience. We are committed to delivering virtually instant funding capabilities, intuitive self-service tools, and transparent reporting that empowers our clients to manage their cash flow with confidence and clarity. By prioritizing innovation and automation, we are not only streamlining operations but also setting a new standard for speed, accessibility, and trust in the factoring space.
In previous letters, we introduced our Instant Decision model which is powered by AI/ML coupled with our Network data and our risk management program. The model continues to deliver measurable value, although material ROI will be recognized as client growth is achieved. This allows us to scale intelligently, particularly within our small carrier segment, consisting of carriers with 1 to 5 trucks, where we can grow by up to 30% without increasing headcount.
The immediate operational improvements in our small carrier segment include:
•57% reduction in short pays
•65% decrease in chargebacks
•25% fewer disputes
These results reflect the model’s ability to make accurate, real-time decisions which reduces friction and improves transaction quality across the board. The model not only unlocks existing capacity, but also lays the foundation for scalable efficient growth. Additionally, we have started beta testing our large segment where our clients submit invoices in batches rather than a single invoice submission to expand the model across most of our portfolio.
8
In our FaaS offering, progress continues as expected. Last quarter, we emphasized our focus on optimizing the origination process, an essential step in building a strong foundation for delivering a best-in-class client experience. This initiative is also helping us unify our enterprise value proposition across Factoring, FaaS, and LoadPay.
Factoring segment and revenue growth. Our factoring segment is positioned to capitalize on growth. We are taking deliberate steps to increase market share through a combination of additional FaaS clients and organic growth. Simultaneously, we are broadening our supply chain finance portfolio. As part of our long-term value strategy, we continue to innovate by bundling our products to better service clients across all segments and at the enterprise. In the up-market segment, we complement our factoring offering with equipment, and banking services. For our small carrier segment, we offer 24x7x365 funding with LoadPay. For all segments, we can offer additional benefits including fuel programs and insurance.
These bundled offerings not only simplify the client experience but also strengthen client relationships, driving sustainable growth and value for our shareholders.
Intelligence
1.Why we are pursuing this opportunity
2.Why we will build a better product than existing offerings
Why we are pursuing this opportunity. As we discussed in our last shareholder letter, our Intelligence offerings have been a part of our strategic plan for some time now, driven largely by requests from our broker customers to leverage the breadth and scale of our Network to provide data and insights back to them. Investors will also recall that the key principles, and the right-to-win, of our Intelligence offerings are neutrality, density and veracity.
Our Network has always served as a neutral partner to our customers. Our entrance into this space within the transportation industry comes at a time when we have crossed the network density threshold which we outlined over the course of multiple shareholder letters (>50% of brokered freight).
It is our core transaction — the transmission and auditing of data in furtherance of making a payment — that provides the highly differentiated veracity in our data. As the old saying goes, “follow the money.” To audit freight bills, make payments and help safeguard against fraud, Triumph requires a very precise understanding of how much is actually being paid to a carrier, for which movement, when the movement occurred, and how that payable breaks down across linehaul, fuel and other accessorials. We believe there is no cleaner and more precise data generated for a rating product.
9
Accelerating and scaling the Greenscreens technology platform and network with the rich and precise data from our core transactions will be an immediate focus upon successful closing of the acquisition. Investors likely expect that this will increase the value of this pricing product suite to freight brokers, but it may be less obvious exactly how. Let’s dive a bit deeper into this.
Why we are building a better product than existing offerings. While there are plenty of metrics referenced by rating providers in marketing materials, two critically important ones that drive the value derived by customers are (i) the density of data used to train the models and (ii) the accuracy with which such models reflect current market dynamics (and in particular the current market dynamics applicable to a particular broker customer for a particular lane and type freight being hauled). Generally speaking, this accuracy is improved as density of data increases, but only if the data is high quality and accurate. If the data in these models is polluted with imprecise, duplicative or untimely information, the size of the dataset becomes simply a vanity metric. Going back to the discussion above on the quality of data collected during our core transaction, this is where we believe Triumph will be able to bring an industry-leading rating product to market building on Greenscreens’ success to-date.
Customers of rating products don’t derive value just because there is a large dataset. They derive value if the rating product helps them accurately understand current market dynamics in order to quote freight to shippers and buy capacity from carriers. If a broker is able to quote freight to shippers while understanding more precisely the market rates for a carrier hauling a given load, the broker is empowered to better protect and improve margins. Greenscreens takes the approach of creating a unique model for each broker of size, incorporating their buying power, carrier network and other historical trends specific to their business. In doing so, they are able to offer a product with far greater veracity and accuracy than other incumbents who create a single market rate by which shippers, brokers and carriers are all referencing the same rate.
To contextualize some of the rationale for our Isometric Technologies (“ISO”) acquisition late last year, we see an opportunity to further improve the modeling and power of the rating product and other Intelligence offerings on our roadmap. In brokered freight, not all loads are the same. There are certain loads where finding a low-cost carrier is completely sufficient. Alternatively, there are loads where a high level of service is required for a variety of reasons (important customer, high value cargo, punitive late fees). We believe combining the service benchmarking capabilities of ISO with the ratings product of Greenscreens will further allow brokers to more precisely understand and transact in the various markets and sub-markets of freight as compared to the current state with incumbents who do not allow for these quantifiable tradeoffs.
For a simple example, for a broker that has a purchased transportation volume of $200 million, even a 1% improvement in operating margin equates to $2 million dollars which drops directly to the bottom line. Roughly 85% of a broker’s expense is tied to the cost of purchased transportation, so the value impact to them for a robust Intelligence product is disproportionately high relative to our other transportation offerings. We believe we have a tremendous opportunity in our Intelligence offerings to drive these operating margin improvements for our customers while creating value for our shareholders.
Banking
1.Analysis of financial and operational performance for the quarter
2.Credit update
Analysis of financial and operational performance for the quarter. Banking segment operating income increased $0.6 million to $27.6 million, or 2.1%, from the prior quarter. Lower credit loss expense was partially offset by lower interest income, driven by fewer days in the quarter and a shift in asset mix toward lower yielding products. Non-interest expenses were up modestly due to FICA and bonus accrual resets. On funding, we were able to hold deposit costs flat, with period end balances up on the quarter, driven by core deposit growth of approximately $175 million and increased TriumphPay float of $110 million. Overall, funding costs increased by 4 basis points to 1.45%. Looking forward, our modeling suggests that each 25-basis point rate cut would reduce our consolidated quarterly net interest income by $0.5 - 1.0 million.
10
Credit Update. We are pleased with the improvement this quarter in credit metrics as well as the aforementioned improvement in credit loss expenses. We expect continued improvement in credit metrics based on progress in refinancing other classified assets, but we are closely monitoring the performance of clients with exposure to imports from high tariff countries and industries.
•Nonperforming loans to total loans improved by 42 bps
•Classified assets decreased by $61 million
•Credit loss expenses decreased by $3.1 million
Expense Forecast & Closing Thoughts
Non-core expenses for the quarter included severance, expenses related to our pending acquisition of Greenscreens and lease termination expenses in the building we acquired last year to be our future headquarters.
As I noted in my January letter, operating expenses ticked up in the first quarter with annual compensation resets and other initiatives. For the second, quarter we project core operating expenses to be roughly $99 million (exclusive of any impact from the pending Greenscreens acquisition), and absent meaningful revenue growth we do not anticipate adding materially to that run rate for the balance of the year. We expect to close the acquisition during the second quarter, and I will share details about its impact in my next letter.
The near-term transportation market remains very difficult, but I am as convinced as ever that we are building something incredibly valuable that the market needs, and nobody is better positioned to win than we are. We are working hard to deliver that value to our customers and our shareholders, and I look forward to sharing our progress along the way.
With warm regards,
Aaron P. Graft Founder, Vice Chairman & CEO
[1] We define Network engagement as the amount of freight touched through our payments, audit or full AP automation products. It is an indicator of our broker volume density in the market, the source for growing available Network transactions, and a key value driver for factors on the Network.
[2] This reference to brokered freight is specific to domestic truckload (“TL”) freight only. Thus, this calculation would exclude less than truckload ("LTL"), parcel, etc. It would also exclude shipper volumes. Admittedly, this is a difficult percentage to calculate with precision, and it will move from year to year. That being said, we can evaluate the number of payments received in our factoring segment as a proxy for the percentage of TL freight TriumphPay is touching and also use industry data points to make informed assumptions. In the end, this goal is not intended to be a precise measurement in the same way as we would measure earnings. It is a directional and blunt measurement of the reach of the Network.
[3] Average invoice sizes in our payments segment are generally smaller than average invoice sizes in our factoring segment as a transportation factor generally will only factor long-haul trucking invoices. Less than truckload ("LTL") and parcel typically are not regularly serviced by the transportation factoring industry due to their small ticket size. Our payments business pays all transportation invoices of a freight broker and, as such, includes some LTL, parcel and shorter hauls that a transportation factor normally will not service.
[4] Recurring cohort revenue is defined as quickpay revenue and fee revenue attributable to clients onboarded in the annual cohorts shown. It does not include nonrecurring fees or gains, float revenue, or other supply chain finance income aside from quickpays. Average Invoice size presented excludes shipper and freight broker factoring invoices
11
Conference Call Information
Aaron P. Graft, Vice Chairman and CEO, and Brad Voss, CFO, will review the financial results in a conference call with investors and analysts beginning at 9:30 a.m. central time on Thursday, April 17, 2025.
The live video conference option may be accessed directly through this link, https://triumph-financial-q1-2025-earnings.open-exchange.net/ or via the Company's website at tfin.com through the News & Events, Events & Presentations links. Alternatively, a live conference call option is available by dialing 1-833-928-4610 (International: 1-800-456-1369) requesting to be joined to meeting ID 970 6106 3843 at the prompt. An archive of this conference call will subsequently be available at this same location, referenced above, on the Company’s website.
About Triumph Financial
Triumph Financial, Inc. (Nasdaq: TFIN) is a financial holding company focused on payments, factoring, intelligence and banking. Headquartered in Dallas, Texas, its diversified portfolio of brands includes TriumphPay, Triumph, TBK Bank and LoadPay. www.tfin.com
Forward-Looking Statements
This letter to shareholders contains forward-looking statements. Any statements about our expectations, beliefs, plans, predictions, forecasts, objectives, assumptions or future events or performance are not historical facts and may be forward-looking. You can identify forward-looking statements by the use of forward-looking terminology such as “believes,” “expects,” “could,” “may,” “will,” “should,” “seeks,” “likely,” “intends,” “plans,” “pro forma,” “projects,” “estimates” or “anticipates” or the negative of these words and phrases or similar words or phrases that are predictions of or indicate future events or trends and that do not relate solely to historical matters. You can also identify forward-looking statements by discussions of strategy, plans or intentions. Forward-looking statements involve numerous risks and uncertainties, and you should not rely on them as predictions of future events. Forward-looking statements depend on assumptions, data or methods that may be incorrect or imprecise and we may not be able to realize them. We do not guarantee that the transactions and events described will happen as described (or that they will happen at all). The following factors, among others, could cause actual results and future events to differ materially from those set forth or contemplated in the forward-looking statements: business and economic conditions generally and in the bank and non-bank financial services industries, nationally and within our local market areas; our ability to mitigate our risk exposures; our ability to maintain our historical earnings trends; changes in management personnel; interest rate risk; concentration of our products and services in the transportation industry; credit risk associated with our loan portfolio; lack of seasoning in our loan portfolio; deteriorating asset quality and higher loan charge-offs; time and effort necessary to resolve nonperforming assets; inaccuracy of the assumptions and estimates we make in establishing reserves for probable loan losses and other estimates; risks related to the integration of acquired businesses and any future acquisitions; our ability to successfully identify and address the risks associated with our possible future acquisitions, and the risks that our prior and possible future acquisitions make it more difficult for investors to evaluate our business, financial condition and results of operations, and impairs our ability to accurately forecast our future performance; lack of liquidity; fluctuations in the fair value and liquidity of the securities we hold for sale; impairment of investment securities, goodwill, other intangible assets or deferred tax assets; our risk management strategies; environmental liability associated with our lending activities; increased competition in the bank and non-bank financial services industries, nationally, regionally or locally, which may adversely affect pricing and terms; the accuracy of our financial statements and related disclosures; material weaknesses in our internal control over financial reporting; system failures or failures to prevent breaches of our network security; the institution and outcome of litigation and other legal proceedings against us or to which we become subject; changes in carry-forwards of net operating losses; changes in federal tax law or policy; the impact of recent and future legislative and regulatory changes, including changes in banking, securities and tax laws and regulations, such as the Dodd-Frank Act and their application by our regulators as well as privacy, cybersecurity, and artificial intelligence regulation and oversight; governmental monetary and fiscal policies; changes in the scope and cost of FDIC, insurance and other coverages; failure to receive regulatory approval for future acquisitions and increases in our capital requirements.
12
While forward-looking statements reflect our good-faith beliefs, they are not guarantees of future performance. All forward-looking statements are necessarily only estimates of future results. Accordingly, actual results may differ materially from those expressed in or contemplated by the particular forward-looking statement, and, therefore, you are cautioned not to place undue reliance on such statements. Further, any forward-looking statement speaks only as of the date on which it is made, and we undertake no obligation to update any forward-looking statement to reflect events or circumstances after the date on which the statement is made or to reflect the occurrence of unanticipated events or circumstances, except as required by applicable law. For a discussion of such risks and uncertainties, which could cause actual results to differ from those contained in the forward-looking statements, see "Risk Factors" and the forward-looking statement disclosure contained in Triumph Financial’s Annual Report on Form 10-K, filed with the Securities and Exchange Commission on February 11, 2025.
Non-GAAP Financial Measures
This letter to shareholders includes certain non‐GAAP financial measures intended to supplement, not substitute for, comparable GAAP measures. Reconciliations of non‐GAAP financial measures to GAAP financial measures are provided at the end of this letter to shareholders.
13
The following table sets forth key metrics used by Triumph Financial to monitor our operations. Footnotes in this table can be found in our definitions of non-GAAP financial measures at the end of this document.
| As of and for the Three Months Ended | |||||||||||||||||||||||||||||
| (Dollars in thousands) | March 31, 2025 | December 31, 2024 | September 30, 2024 | June 30, 2024 | March 31, 2024 | ||||||||||||||||||||||||
| Financial Highlights: | |||||||||||||||||||||||||||||
| Total assets | $ | 6,268,394 | $ | 5,948,975 | $ | 5,866,046 | $ | 5,783,334 | $ | 5,575,493 | |||||||||||||||||||
| Loans held for investment | $ | 4,666,223 | $ | 4,546,960 | $ | 4,332,967 | $ | 4,288,417 | $ | 4,195,120 | |||||||||||||||||||
| Deposits | $ | 4,976,750 | $ | 4,820,820 | $ | 4,706,694 | $ | 4,392,018 | $ | 4,450,963 | |||||||||||||||||||
| Net income available to common stockholders | $ | (784) | $ | 3,036 | $ | 4,546 | $ | 1,945 | $ | 3,357 | |||||||||||||||||||
| Performance Ratios - Annualized: | |||||||||||||||||||||||||||||
| Return on average assets | — | % | 0.26 | % | 0.36 | % | 0.19 | % | 0.31 | % | |||||||||||||||||||
| Return on average total equity | 0.01 | % | 1.70 | % | 2.39 | % | 1.26 | % | 1.90 | % | |||||||||||||||||||
| Return on average common equity | (0.37 | %) | 1.41 | % | 2.14 | % | 0.94 | % | 1.62 | % | |||||||||||||||||||
Return on average tangible common equity (1) | (0.53 | %) | 2.01 | % | 3.07 | % | 1.35 | % | 2.33 | % | |||||||||||||||||||
| Yield on loans | 8.37 | % | 8.48 | % | 8.85 | % | 9.10 | % | 9.09 | % | |||||||||||||||||||
| Cost of interest bearing deposits | 2.14 | % | 2.17 | % | 2.20 | % | 2.34 | % | 1.99 | % | |||||||||||||||||||
| Cost of total deposits | 1.23 | % | 1.22 | % | 1.23 | % | 1.39 | % | 1.17 | % | |||||||||||||||||||
| Cost of total funds | 1.45 | % | 1.41 | % | 1.57 | % | 1.62 | % | 1.45 | % | |||||||||||||||||||
| Net interest margin | 6.49 | % | 6.65 | % | 6.81 | % | 7.07 | % | 7.29 | % | |||||||||||||||||||
| Net noninterest expense to average assets | 5.61 | % | 5.17 | % | 5.29 | % | 5.67 | % | 5.62 | % | |||||||||||||||||||
Asset Quality:(2) | |||||||||||||||||||||||||||||
| Past due to total loans | 3.24 | % | 3.27 | % | 2.62 | % | 2.21 | % | 1.90 | % | |||||||||||||||||||
| Non-performing loans to total loans | 2.07 | % | 2.49 | % | 2.62 | % | 1.94 | % | 1.98 | % | |||||||||||||||||||
| Non-performing assets to total assets | 1.64 | % | 2.02 | % | 2.07 | % | 1.60 | % | 1.61 | % | |||||||||||||||||||
| ACL to non-performing loans | 37.47 | % | 35.93 | % | 36.28 | % | 47.48 | % | 45.93 | % | |||||||||||||||||||
| ACL to total loans | 0.78 | % | 0.90 | % | 0.95 | % | 0.92 | % | 0.91 | % | |||||||||||||||||||
| Net charge-offs to average loans | 0.13 | % | 0.11 | % | 0.08 | % | 0.06 | % | 0.05 | % | |||||||||||||||||||
| Capital: | |||||||||||||||||||||||||||||
Tier 1 capital to average assets(3) | 12.04 | % | 12.03 | % | 12.21 | % | 12.38 | % | 12.99 | % | |||||||||||||||||||
Tier 1 capital to risk-weighted assets(3) | 12.90 | % | 13.06 | % | 13.57 | % | 13.45 | % | 13.62 | % | |||||||||||||||||||
Common equity tier 1 capital to risk-weighted assets(3) | 11.27 | % | 11.40 | % | 11.85 | % | 11.71 | % | 11.85 | % | |||||||||||||||||||
| Total capital to risk-weighted assets | 14.93 | % | 15.23 | % | 16.62 | % | 16.51 | % | 16.69 | % | |||||||||||||||||||
| Total equity to total assets | 14.26 | % | 14.98 | % | 15.10 | % | 15.12 | % | 15.65 | % | |||||||||||||||||||
Tangible common stockholders' equity to tangible assets(1) | 9.86 | % | 10.33 | % | 10.50 | % | 10.39 | % | 10.71 | % | |||||||||||||||||||
| Per Share Amounts: | |||||||||||||||||||||||||||||
| Book value per share | $ | 36.25 | $ | 36.16 | $ | 35.95 | $ | 35.51 | $ | 35.45 | |||||||||||||||||||
Tangible book value per share (1) | $ | 25.32 | $ | 25.13 | $ | 25.22 | $ | 24.60 | $ | 24.42 | |||||||||||||||||||
| Basic earnings per common share | $ | (0.03) | $ | 0.13 | $ | 0.19 | $ | 0.08 | $ | 0.14 | |||||||||||||||||||
| Diluted earnings per common share | $ | (0.03) | $ | 0.13 | $ | 0.19 | $ | 0.08 | $ | 0.14 | |||||||||||||||||||
| Shares outstanding end of period | 23,419,740 | 23,391,411 | 23,387,522 | 23,353,519 | 23,334,997 | ||||||||||||||||||||||||
14
Unaudited consolidated balance sheet as of:
| (Dollars in thousands) | March 31, 2025 | December 31, 2024 | September 30, 2024 | June 30, 2024 | March 31, 2024 | ||||||||||||||||||||||||
| ASSETS | |||||||||||||||||||||||||||||
| Total cash and cash equivalents | $ | 502,944 | $ | 330,117 | $ | 489,280 | $ | 500,663 | $ | 417,033 | |||||||||||||||||||
| Securities - available for sale | 411,925 | 381,561 | 403,186 | 339,661 | 320,101 | ||||||||||||||||||||||||
| Securities - held to maturity, net | 1,731 | 1,876 | 2,121 | 2,787 | 3,010 | ||||||||||||||||||||||||
| Equity securities with readily determinable fair value | 4,512 | 4,445 | 4,583 | 4,422 | 4,441 | ||||||||||||||||||||||||
| Loans held for sale | 2,950 | 1,172 | 26 | 1,051 | 3,712 | ||||||||||||||||||||||||
| Loans held for investment | 4,666,223 | 4,546,960 | 4,332,967 | 4,288,417 | 4,195,120 | ||||||||||||||||||||||||
| Allowance for credit losses | (36,229) | (40,714) | (41,243) | (39,591) | (38,232) | ||||||||||||||||||||||||
| Loans, net | 4,629,994 | 4,506,246 | 4,291,724 | 4,248,826 | 4,156,888 | ||||||||||||||||||||||||
| FHLB and other restricted stock | 12,987 | 14,054 | 7,112 | 14,040 | 4,764 | ||||||||||||||||||||||||
| Premises and equipment, net | 150,247 | 160,737 | 156,462 | 159,588 | 162,544 | ||||||||||||||||||||||||
| Capitalized software, net | 40,869 | 37,971 | 34,481 | 30,582 | 26,435 | ||||||||||||||||||||||||
| Goodwill | 241,949 | 241,949 | 233,709 | 233,709 | 233,709 | ||||||||||||||||||||||||
| Intangible assets, net | 13,963 | 16,259 | 17,316 | 20,943 | 23,842 | ||||||||||||||||||||||||
| Bank-owned life insurance | 63,200 | 62,690 | 42,381 | 42,225 | 42,077 | ||||||||||||||||||||||||
| Deferred tax asset, net | 11,868 | 13,581 | 10,667 | 6,641 | 7,946 | ||||||||||||||||||||||||
| Other assets | 179,255 | 176,317 | 172,998 | 178,196 | 168,991 | ||||||||||||||||||||||||
| Total assets | $ | 6,268,394 | $ | 5,948,975 | $ | 5,866,046 | $ | 5,783,334 | $ | 5,575,493 | |||||||||||||||||||
| LIABILITIES | |||||||||||||||||||||||||||||
| Noninterest bearing deposits | $ | 2,260,048 | $ | 1,964,457 | $ | 2,103,092 | $ | 1,689,531 | $ | 1,747,544 | |||||||||||||||||||
| Interest bearing deposits | 2,716,702 | 2,856,363 | 2,603,602 | 2,702,487 | 2,703,419 | ||||||||||||||||||||||||
| Total deposits | 4,976,750 | 4,820,820 | 4,706,694 | 4,392,018 | 4,450,963 | ||||||||||||||||||||||||
| Federal Home Loan Bank advances | 205,000 | 30,000 | 30,000 | 280,000 | 30,000 | ||||||||||||||||||||||||
| Subordinated notes | 69,732 | 69,662 | 109,072 | 108,939 | 108,807 | ||||||||||||||||||||||||
| Junior subordinated debentures | 42,507 | 42,352 | 42,196 | 42,042 | 41,889 | ||||||||||||||||||||||||
| Other liabilities | 80,478 | 95,222 | 92,320 | 86,086 | 71,495 | ||||||||||||||||||||||||
| Total liabilities | 5,374,467 | 5,058,056 | 4,980,282 | 4,909,085 | 4,703,154 | ||||||||||||||||||||||||
| EQUITY | |||||||||||||||||||||||||||||
| Preferred Stock | 45,000 | 45,000 | 45,000 | 45,000 | 45,000 | ||||||||||||||||||||||||
| Common stock | 292 | 291 | 291 | 291 | 290 | ||||||||||||||||||||||||
| Additional paid-in-capital | 572,143 | 567,884 | 564,464 | 559,072 | 555,613 | ||||||||||||||||||||||||
| Treasury stock, at cost | (268,520) | (268,356) | (268,352) | (268,352) | (265,119) | ||||||||||||||||||||||||
| Retained earnings | 548,431 | 549,215 | 546,179 | 541,633 | 539,688 | ||||||||||||||||||||||||
| Accumulated other comprehensive income (loss) | (3,419) | (3,115) | (1,818) | (3,395) | (3,133) | ||||||||||||||||||||||||
| Total stockholders' equity | 893,927 | 890,919 | 885,764 | 874,249 | 872,339 | ||||||||||||||||||||||||
| Total liabilities and equity | $ | 6,268,394 | $ | 5,948,975 | $ | 5,866,046 | $ | 5,783,334 | $ | 5,575,493 | |||||||||||||||||||
15
Unaudited consolidated statement of income:
| For the Three Months Ended | |||||||||||||||||||||||||||||
| (Dollars in thousands) | March 31, 2025 | December 31, 2024 | September 30, 2024 | June 30, 2024 | March 31, 2024 | ||||||||||||||||||||||||
| Interest income: | |||||||||||||||||||||||||||||
| Loans, including fees | $ | 53,576 | $ | 52,493 | $ | 52,886 | $ | 54,900 | $ | 53,552 | |||||||||||||||||||
| Factored receivables, including fees | 38,694 | 41,351 | 40,598 | 40,028 | 37,909 | ||||||||||||||||||||||||
| Securities | 5,308 | 6,182 | 6,500 | 5,523 | 5,351 | ||||||||||||||||||||||||
| FHLB and other restricted stock | 249 | 153 | 379 | 234 | 232 | ||||||||||||||||||||||||
| Cash deposits | 4,443 | 5,299 | 7,712 | 6,330 | 4,903 | ||||||||||||||||||||||||
| Total interest income | 102,270 | 105,478 | 108,075 | 107,015 | 101,947 | ||||||||||||||||||||||||
| Interest expense: | |||||||||||||||||||||||||||||
| Deposits | 14,397 | 14,522 | 14,041 | 15,520 | 12,152 | ||||||||||||||||||||||||
| Subordinated notes | 682 | 1,024 | 1,227 | 1,225 | 1,224 | ||||||||||||||||||||||||
| Junior subordinated debentures | 994 | 1,129 | 1,172 | 1,162 | 1,184 | ||||||||||||||||||||||||
| Other borrowings | 1,814 | 996 | 2,936 | 1,193 | 1,352 | ||||||||||||||||||||||||
| Total interest expense | 17,887 | 17,671 | 19,376 | 19,100 | 15,912 | ||||||||||||||||||||||||
| Net interest income | 84,383 | 87,807 | 88,699 | 87,915 | 86,035 | ||||||||||||||||||||||||
| Credit loss expense (benefit) | 1,330 | 4,453 | 4,263 | 4,155 | 5,896 | ||||||||||||||||||||||||
| Net interest income after credit loss expense (benefit) | 83,053 | 83,354 | 84,436 | 83,760 | 80,139 | ||||||||||||||||||||||||
| Noninterest income: | |||||||||||||||||||||||||||||
| Service charges on deposits | 1,596 | 1,682 | 1,865 | 1,810 | 1,727 | ||||||||||||||||||||||||
| Card income | 1,797 | 1,948 | 2,135 | 2,085 | 1,868 | ||||||||||||||||||||||||
| Net gains (losses) on sale of securities | — | (1) | — | — | — | ||||||||||||||||||||||||
| Net gains (losses) on sale of loans | 134 | (6) | 253 | 123 | (192) | ||||||||||||||||||||||||
| Fee income | 9,114 | 9,048 | 9,129 | 8,517 | 8,683 | ||||||||||||||||||||||||
| Insurance commissions | 1,250 | 1,338 | 1,472 | 1,505 | 1,568 | ||||||||||||||||||||||||
| Other | 3,299 | 1,742 | 2,643 | 3,127 | 1,345 | ||||||||||||||||||||||||
| Total noninterest income | 17,190 | 15,751 | 17,497 | 17,167 | 14,999 | ||||||||||||||||||||||||
| Noninterest expense: | |||||||||||||||||||||||||||||
| Salaries and employee benefits | 58,718 | 53,943 | 55,447 | 56,005 | 54,185 | ||||||||||||||||||||||||
| Occupancy, furniture and equipment | 8,442 | 8,112 | 8,701 | 8,565 | 7,636 | ||||||||||||||||||||||||
| FDIC insurance and other regulatory assessments | 727 | 744 | 679 | 641 | 653 | ||||||||||||||||||||||||
| Professional fees | 6,064 | 5,006 | 4,734 | 4,558 | 3,541 | ||||||||||||||||||||||||
| Amortization of intangible assets | 2,400 | 2,799 | 3,600 | 2,869 | 2,724 | ||||||||||||||||||||||||
| Advertising and promotion | 1,464 | 1,545 | 1,416 | 2,008 | 1,214 | ||||||||||||||||||||||||
| Communications and technology | 12,244 | 12,299 | 12,422 | 14,307 | 11,894 | ||||||||||||||||||||||||
| Software amortization | 1,992 | 1,831 | 1,484 | 1,357 | 1,174 | ||||||||||||||||||||||||
| Travel and entertainment | 1,492 | 975 | 1,431 | 1,513 | 1,509 | ||||||||||||||||||||||||
| Other | 6,630 | 6,021 | 5,732 | 5,520 | 5,841 | ||||||||||||||||||||||||
| Total noninterest expense | 100,173 | 93,275 | 95,646 | 97,343 | 90,371 | ||||||||||||||||||||||||
| Net income before income tax | 70 | 5,830 | 6,287 | 3,584 | 4,767 | ||||||||||||||||||||||||
| Income tax expense | 53 | 1,992 | 940 | 837 | 609 | ||||||||||||||||||||||||
| Net income | $ | 17 | $ | 3,838 | $ | 5,347 | $ | 2,747 | $ | 4,158 | |||||||||||||||||||
| Dividends on preferred stock | (801) | (802) | (801) | (802) | (801) | ||||||||||||||||||||||||
| Net income available to common stockholders | $ | (784) | $ | 3,036 | $ | 4,546 | $ | 1,945 | $ | 3,357 | |||||||||||||||||||
16
Earnings per share:
| For the Three Months Ended | |||||||||||||||||||||||||||||
| (Dollars in thousands) | March 31, 2025 | December 31, 2024 | September 30, 2024 | June 30, 2024 | March 31, 2024 | ||||||||||||||||||||||||
| Basic | |||||||||||||||||||||||||||||
| Net income (loss) to common stockholders | $ | (784) | $ | 3,036 | $ | 4,546 | $ | 1,945 | $ | 3,357 | |||||||||||||||||||
| Weighted average common shares outstanding | 23,362,400 | 23,339,651 | 23,330,635 | 23,274,089 | 23,201,259 | ||||||||||||||||||||||||
| Basic earnings (loss) per common share | $ | (0.03) | $ | 0.13 | $ | 0.19 | $ | 0.08 | $ | 0.14 | |||||||||||||||||||
| Diluted | |||||||||||||||||||||||||||||
| Net income (loss) to common stockholders - diluted | $ | (784) | $ | 3,036 | $ | 4,546 | $ | 1,945 | $ | 3,357 | |||||||||||||||||||
| Weighted average common shares outstanding | 23,362,400 | 23,339,651 | 23,330,635 | 23,274,089 | 23,201,259 | ||||||||||||||||||||||||
| Dilutive effects of: | |||||||||||||||||||||||||||||
| Assumed exercises of stock options | — | 106,713 | 95,472 | 86,645 | 87,567 | ||||||||||||||||||||||||
| Restricted stock awards | — | 43,875 | 40,259 | 60,614 | 102,417 | ||||||||||||||||||||||||
| Restricted stock units | — | 153,326 | 130,331 | 118,919 | 137,321 | ||||||||||||||||||||||||
| Performance stock units - market based | — | 223,173 | 128,157 | 121,907 | 119,777 | ||||||||||||||||||||||||
| Employee stock purchase plan | — | 2,711 | 470 | 2,931 | 1,921 | ||||||||||||||||||||||||
| Weighted average shares outstanding - diluted | 23,362,400 | 23,869,449 | 23,725,324 | 23,665,105 | 23,650,262 | ||||||||||||||||||||||||
| Diluted earnings (loss) per common share | $ | (0.03) | $ | 0.13 | $ | 0.19 | $ | 0.08 | $ | 0.14 | |||||||||||||||||||
Shares that were not considered in computing diluted earnings per common share because they were antidilutive or have not met the thresholds to be considered in the dilutive calculation are as follows:
| For the Three Months Ended | |||||||||||||||||||||||||||||
| March 31, 2025 | December 31, 2024 | September 30, 2024 | June 30, 2024 | March 31, 2024 | |||||||||||||||||||||||||
| Stock options | 253,629 | 43,582 | 64,315 | 77,520 | 45,764 | ||||||||||||||||||||||||
| Restricted stock awards | 48,076 | — | — | — | — | ||||||||||||||||||||||||
| Restricted stock units | 203,812 | — | 7,500 | 7,500 | 7,500 | ||||||||||||||||||||||||
| Performance stock units - market based | 82,020 | 23,476 | — | 55,677 | — | ||||||||||||||||||||||||
| Employee stock purchase plan | — | — | — | — | — | ||||||||||||||||||||||||
Loans held for investment summarized as of:
| (Dollars in thousands) | March 31, 2025 | December 31, 2024 | September 30, 2024 | June 30, 2024 | March 31, 2024 | ||||||||||||||||||||||||
| Commercial real estate | $ | 811,244 | $ | 777,689 | $ | 762,343 | $ | 842,342 | $ | 819,721 | |||||||||||||||||||
| Construction, land development, land | 204,021 | 203,804 | 217,148 | 216,531 | 222,859 | ||||||||||||||||||||||||
| 1-4 family residential properties | 159,105 | 154,020 | 126,103 | 128,508 | 130,200 | ||||||||||||||||||||||||
| Farmland | 47,311 | 56,366 | 57,621 | 58,495 | 58,431 | ||||||||||||||||||||||||
| Commercial | 1,121,740 | 1,119,245 | 1,093,477 | 1,092,280 | 1,160,870 | ||||||||||||||||||||||||
| Factored receivables | 1,350,656 | 1,204,510 | 1,201,495 | 1,207,480 | 1,154,047 | ||||||||||||||||||||||||
| Consumer | 7,088 | 8,000 | 6,990 | 7,596 | 7,176 | ||||||||||||||||||||||||
| Mortgage warehouse | 965,058 | 1,023,326 | 867,790 | 735,185 | 641,816 | ||||||||||||||||||||||||
| Total loans | $ | 4,666,223 | $ | 4,546,960 | $ | 4,332,967 | $ | 4,288,417 | $ | 4,195,120 | |||||||||||||||||||
17
Our banking loan portfolio consists of traditional community bank loans as well as commercial finance product lines focused on businesses that require specialized financial solutions and national lending product lines that further diversify our lending operations.
Banking loans held for investment are further summarized below:
| (Dollars in thousands) | March 31, 2025 | December 31, 2024 | September 30, 2024 | June 30, 2024 | March 31, 2024 | ||||||||||||||||||||||||
| Commercial real estate | $ | 811,244 | $ | 777,689 | $ | 762,343 | $ | 842,342 | $ | 819,721 | |||||||||||||||||||
| Construction, land development, land | 204,021 | 203,804 | 217,148 | 216,531 | 222,859 | ||||||||||||||||||||||||
| 1-4 family residential | 159,105 | 154,020 | 126,103 | 128,508 | 130,200 | ||||||||||||||||||||||||
| Farmland | 47,311 | 56,366 | 57,621 | 58,495 | 58,431 | ||||||||||||||||||||||||
| Commercial - General | 274,697 | 285,469 | 284,989 | 294,670 | 308,145 | ||||||||||||||||||||||||
| Commercial - Agriculture | 49,529 | 49,365 | 52,997 | 50,604 | 46,986 | ||||||||||||||||||||||||
| Commercial - Equipment | 529,359 | 511,855 | 488,326 | 468,661 | 440,458 | ||||||||||||||||||||||||
| Commercial - Asset-based lending | 214,000 | 205,353 | 205,476 | 203,634 | 260,043 | ||||||||||||||||||||||||
| Commercial - Liquid Credit | 53,075 | 65,053 | 59,539 | 74,711 | 105,238 | ||||||||||||||||||||||||
| Consumer | 7,088 | 8,000 | 6,990 | 7,596 | 7,176 | ||||||||||||||||||||||||
| Mortgage Warehouse | 965,058 | 1,023,326 | 867,790 | 735,185 | 641,816 | ||||||||||||||||||||||||
| Total banking loans held for investment | $ | 3,314,487 | $ | 3,340,300 | $ | 3,129,322 | $ | 3,080,937 | $ | 3,041,073 | |||||||||||||||||||
The following table presents the Company’s operating segments:
18
| (Dollars in thousands) | Total | Corporate | ||||||||||||||||||||||||||||||||||||||||||
| Three months ended March 31, 2025 | Banking | Factoring | Payments | Intelligence | Segments | and Other(1) | Consolidated | |||||||||||||||||||||||||||||||||||||
| Total interest income | $ | 63,493 | $ | 33,331 | $ | 5,363 | $ | — | $ | 102,187 | $ | 83 | $ | 102,270 | ||||||||||||||||||||||||||||||
| Intersegment interest allocations | 4,735 | (7,653) | 2,918 | — | — | — | — | |||||||||||||||||||||||||||||||||||||
| Total interest expense | 16,211 | — | — | — | 16,211 | 1,676 | 17,887 | |||||||||||||||||||||||||||||||||||||
| Net interest income (expense) | 52,017 | 25,678 | 8,281 | — | 85,976 | (1,593) | 84,383 | |||||||||||||||||||||||||||||||||||||
| Credit loss expense (benefit) | 507 | 560 | 118 | — | 1,185 | 145 | 1,330 | |||||||||||||||||||||||||||||||||||||
| Net interest income after credit loss expense | 51,510 | 25,118 | 8,163 | — | 84,791 | (1,738) | 83,053 | |||||||||||||||||||||||||||||||||||||
| Noninterest income | 7,003 | 1,719 | 6,531 | 395 | 15,648 | 1,542 | 17,190 | |||||||||||||||||||||||||||||||||||||
| Noninterest expense: | ||||||||||||||||||||||||||||||||||||||||||||
| Salaries and employee benefits | 16,317 | 13,222 | 9,613 | 1,484 | 40,636 | 18,082 | 58,718 | |||||||||||||||||||||||||||||||||||||
| Depreciation | 1,630 | 503 | 230 | 7 | 2,370 | 1,574 | 3,944 | |||||||||||||||||||||||||||||||||||||
| Other occupancy, furniture and equipment | 2,102 | 537 | 168 | 7 | 2,814 | 1,684 | 4,498 | |||||||||||||||||||||||||||||||||||||
| FDIC insurance and other regulatory assessments | 727 | — | — | — | 727 | — | 727 | |||||||||||||||||||||||||||||||||||||
| Professional fees | 1,065 | 1,852 | 206 | 951 | 4,074 | 1,990 | 6,064 | |||||||||||||||||||||||||||||||||||||
| Amortization of intangible assets | 385 | 193 | 1,551 | 116 | 2,245 | 155 | 2,400 | |||||||||||||||||||||||||||||||||||||
| Advertising and promotion | 511 | 254 | 381 | 30 | 1,176 | 288 | 1,464 | |||||||||||||||||||||||||||||||||||||
| Communications and technology | 5,015 | 2,274 | 2,469 | 227 | 9,985 | 2,259 | 12,244 | |||||||||||||||||||||||||||||||||||||
| Software amortization | 56 | 594 | 1,196 | 2 | 1,848 | 144 | 1,992 | |||||||||||||||||||||||||||||||||||||
| Travel and entertainment | 238 | 183 | 377 | 118 | 916 | 576 | 1,492 | |||||||||||||||||||||||||||||||||||||
| Other | 3,025 | 741 | 922 | 66 | 4,754 | 1,876 | 6,630 | |||||||||||||||||||||||||||||||||||||
| Total noninterest expense | 31,071 | 20,353 | 17,113 | 3,008 | 71,545 | 28,628 | 100,173 | |||||||||||||||||||||||||||||||||||||
Net intersegment noninterest income (expense)(2) | 137 | 435 | (572) | — | — | — | — | |||||||||||||||||||||||||||||||||||||
| Operating income (loss) | $ | 27,579 | $ | 6,919 | $ | (2,991) | $ | (2,613) | $ | 28,894 | $ | (28,824) | $ | 70 | ||||||||||||||||||||||||||||||
19
| (Dollars in thousands) | Total | Corporate | ||||||||||||||||||||||||||||||||||||||||||
| Three months ended December 31, 2024 | Banking | Factoring | Payments | Intelligence | Segments | and Other(1) | Consolidated | |||||||||||||||||||||||||||||||||||||
| Total interest income | $ | 64,042 | $ | 35,754 | $ | 5,597 | $ | — | $ | 105,393 | $ | 85 | $ | 105,478 | ||||||||||||||||||||||||||||||
| Intersegment interest allocations | 5,773 | (8,503) | 2,730 | — | — | — | — | |||||||||||||||||||||||||||||||||||||
| Total interest expense | 15,519 | — | — | — | 15,519 | 2,152 | 17,671 | |||||||||||||||||||||||||||||||||||||
| Net interest income (expense) | 54,296 | 27,251 | 8,327 | — | 89,874 | (2,067) | 87,807 | |||||||||||||||||||||||||||||||||||||
| Credit loss expense (benefit) | 3,429 | 914 | 2 | — | 4,345 | 108 | 4,453 | |||||||||||||||||||||||||||||||||||||
| Net interest income after credit loss expense | 50,867 | 26,337 | 8,325 | — | 85,529 | (2,175) | 83,354 | |||||||||||||||||||||||||||||||||||||
| Noninterest income | 6,554 | 1,594 | 6,348 | 184 | 14,680 | 1,071 | 15,751 | |||||||||||||||||||||||||||||||||||||
| Noninterest expense: | ||||||||||||||||||||||||||||||||||||||||||||
| Salaries and employee benefits | 15,896 | 12,176 | 8,424 | 1,457 | 37,953 | 15,990 | 53,943 | |||||||||||||||||||||||||||||||||||||
| Depreciation | 1,646 | 527 | 243 | 4 | 2,420 | 1,544 | 3,964 | |||||||||||||||||||||||||||||||||||||
| Other occupancy, furniture and equipment | 2,069 | 520 | 165 | 3 | 2,757 | 1,391 | 4,148 | |||||||||||||||||||||||||||||||||||||
| FDIC insurance and other regulatory assessments | 744 | — | — | — | 744 | — | 744 | |||||||||||||||||||||||||||||||||||||
| Professional fees | 1,089 | 1,518 | 370 | 328 | 3,305 | 1,701 | 5,006 | |||||||||||||||||||||||||||||||||||||
| Amortization of intangible assets | 557 | 362 | 1,687 | — | 2,606 | 193 | 2,799 | |||||||||||||||||||||||||||||||||||||
| Advertising and promotion | 355 | 179 | 306 | 2 | 842 | 703 | 1,545 | |||||||||||||||||||||||||||||||||||||
| Communications and technology | 5,221 | 2,475 | 2,243 | 42 | 9,981 | 2,318 | 12,299 | |||||||||||||||||||||||||||||||||||||
| Software amortization | 58 | 584 | 1,049 | 1 | 1,692 | 139 | 1,831 | |||||||||||||||||||||||||||||||||||||
| Travel and entertainment | 163 | 133 | 351 | 36 | 683 | 292 | 975 | |||||||||||||||||||||||||||||||||||||
| Other | 2,754 | 812 | 982 | 7 | 4,555 | 1,466 | 6,021 | |||||||||||||||||||||||||||||||||||||
| Total noninterest expense | 30,552 | 19,286 | 15,820 | 1,880 | 67,538 | 25,737 | 93,275 | |||||||||||||||||||||||||||||||||||||
Intersegment noninterest income (expense)(2) | 138 | 401 | (539) | — | — | — | — | |||||||||||||||||||||||||||||||||||||
| Operating income (loss) | $ | 27,007 | $ | 9,046 | $ | (1,686) | $ | (1,696) | $ | 32,671 | $ | (26,841) | $ | 5,830 | ||||||||||||||||||||||||||||||
(1) Includes revenue and expense from the Company’s holding company, which does not meet the definition of an operating segment. Also includes corporate shared service costs such as the majority of salaries and benefits expense for our executive leadership team, as well as other selling, general, and administrative shared services costs including human resources, accounting, finance, risk management and a significant amount of information technology expense.
(2) Intersegment noninterest income (expense) includes:
| (Dollars in thousands) | Banking | Factoring | Payments | |||||||||||||||||
| Three Months Ended March 31, 2025 | ||||||||||||||||||||
| Factoring revenue received from Payments | $ | — | $ | 911 | $ | (911) | ||||||||||||||
| Payments revenue received from Factoring | — | (372) | 372 | |||||||||||||||||
| Banking revenue received from Payments and Factoring | 137 | (104) | (33) | |||||||||||||||||
| Intersegment noninterest income (expense) | $ | 137 | $ | 435 | $ | (572) | ||||||||||||||
| Three Months Ended December 31, 2024 | ||||||||||||||||||||
| Factoring revenue received from Payments | $ | — | $ | 864 | $ | (864) | ||||||||||||||
| Payments revenue received from Factoring | — | (356) | 356 | |||||||||||||||||
| Banking revenue received from Payments and Factoring | 138 | (107) | (31) | |||||||||||||||||
| Intersegment noninterest income (expense) | $ | 138 | $ | 401 | $ | (539) | ||||||||||||||
20
Information pertaining to our factoring segment, summarized as of and for the quarters ended:
| Factoring | March 31, 2025 | December 31, 2024 | September 30, 2024 | June 30, 2024 | March 31, 2024 | |||||||||||||||||||||||||||
| Factored receivable period end balance | $ | 1,146,429,000 | $ | 1,032,842,000 | $ | 1,031,633,000 | $ | 1,035,159,000 | $ | 976,761,000 | ||||||||||||||||||||||
| Commercial loans period end balance | $ | 1,080,000 | $ | 2,150,000 | $ | 2,150,000 | $ | — | $ | — | ||||||||||||||||||||||
| Yield on average receivable balance | 12.75 | % | 13.36 | % | 13.57 | % | 14.14 | % | 13.98 | % | ||||||||||||||||||||||
| Current quarter charge-off rate | 0.11 | % | 0.26 | % | 0.07 | % | 0.15 | % | 0.13 | % | ||||||||||||||||||||||
| Factored receivables - transportation concentration | 97 | % | 97 | % | 97 | % | 97 | % | 97 | % | ||||||||||||||||||||||
| Interest income, including fees | $ | 33,331,000 | $ | 35,754,000 | $ | 34,905,000 | $ | 34,307,000 | $ | 32,752,000 | ||||||||||||||||||||||
| Noninterest income | 1,719,000 | 1,594,000 | 2,170,000 | 2,016,000 | 2,903,000 | |||||||||||||||||||||||||||
| Intersegment noninterest income | 911,000 | 864,000 | 864,000 | 750,000 | 750,000 | |||||||||||||||||||||||||||
| Factoring total revenue | 35,961,000 | 38,212,000 | 37,939,000 | 37,073,000 | 36,405,000 | |||||||||||||||||||||||||||
| Average net funds employed | 948,729,000 | 950,776,000 | 915,257,000 | 873,355,000 | 839,136,000 | |||||||||||||||||||||||||||
| Yield on average net funds employed | 15.37 | % | 15.99 | % | 16.49 | % | 17.07 | % | 17.45 | % | ||||||||||||||||||||||
| Operating income (loss) | $ | 6,919,000 | $ | 9,046,000 | $ | 7,963,000 | $ | 4,627,000 | $ | 7,091,000 | ||||||||||||||||||||||
| Factoring total revenue | $ | 35,961,000 | $ | 38,212,000 | $ | 37,939,000 | $ | 37,073,000 | $ | 36,405,000 | ||||||||||||||||||||||
Operating margin(1) | 19.24 | % | 23.67 | % | 20.99 | % | 12.48 | % | 19.48 | % | ||||||||||||||||||||||
| Accounts receivable purchased | $ | 2,707,805,000 | $ | 2,747,351,000 | $ | 2,610,177,000 | $ | 2,542,327,000 | $ | 2,469,797,000 | ||||||||||||||||||||||
| Number of invoices purchased | 1,497,644 | 1,524,904 | 1,480,824 | 1,432,366 | 1,367,625 | |||||||||||||||||||||||||||
| Average invoice size | $ | 1,808 | $ | 1,802 | $ | 1,763 | $ | 1,775 | $ | 1,806 | ||||||||||||||||||||||
| Average invoice size - transportation | $ | 1,769 | $ | 1,767 | $ | 1,724 | $ | 1,738 | $ | 1,771 | ||||||||||||||||||||||
| Average invoice size - non-transportation | $ | 4,019 | $ | 4,867 | $ | 4,940 | $ | 4,561 | $ | 4,099 | ||||||||||||||||||||||
(1)Operating margin is a non-GAAP financial measure used as a supplemental measure to evaluate the performance of our Factoring segment.
21
Information pertaining to our Payments segment, summarized as of and for the quarters ended:
| Payments | March 31, 2025 | December 31, 2024 | September 30, 2024 | June 30, 2024 | March 31, 2024 | |||||||||||||||||||||||||||
| Supply chain financing factored receivables | $ | 122,583,000 | $ | 107,300,000 | $ | 101,336,000 | $ | 95,163,000 | $ | 98,593,000 | ||||||||||||||||||||||
| Quickpay and other factored receivables | 81,644,000 | 64,368,000 | 68,526,000 | 77,158,000 | 78,693,000 | |||||||||||||||||||||||||||
| Total factored receivable period end balance | $ | 204,227,000 | $ | 171,668,000 | $ | 169,862,000 | $ | 172,321,000 | $ | 177,286,000 | ||||||||||||||||||||||
| Total revenue | ||||||||||||||||||||||||||||||||
| Supply chain finance interest income | $ | 2,695,000 | $ | 2,789,000 | $ | 2,897,000 | $ | 2,649,000 | $ | 2,553,000 | ||||||||||||||||||||||
| Quickpay interest income | 2,668,000 | 2,808,000 | 2,796,000 | 3,072,000 | 2,604,000 | |||||||||||||||||||||||||||
| Intersegment interest income allocation | 2,918,000 | 2,730,000 | 2,569,000 | 2,010,000 | 2,161,000 | |||||||||||||||||||||||||||
| Total interest income | 8,281,000 | 8,327,000 | 8,262,000 | 7,731,000 | 7,318,000 | |||||||||||||||||||||||||||
| Broker noninterest income | 5,178,000 | 5,082,000 | 4,804,000 | 4,392,000 | 4,115,000 | |||||||||||||||||||||||||||
| Factor noninterest income | 1,233,000 | 1,346,000 | 1,339,000 | 1,296,000 | 1,295,000 | |||||||||||||||||||||||||||
| Other noninterest income | 120,000 | (80,000) | 179,000 | 179,000 | 133,000 | |||||||||||||||||||||||||||
| Intersegment noninterest income | 372,000 | 356,000 | 289,000 | 264,000 | 265,000 | |||||||||||||||||||||||||||
| Total noninterest income | 6,903,000 | 6,704,000 | 6,611,000 | 6,131,000 | 5,808,000 | |||||||||||||||||||||||||||
| $ | 15,184,000 | $ | 15,031,000 | $ | 14,873,000 | $ | 13,862,000 | $ | 13,126,000 | |||||||||||||||||||||||
| Total expense | ||||||||||||||||||||||||||||||||
| Credit loss expense (benefit) | $ | 118,000 | $ | 2,000 | $ | (5,000) | $ | (9,000) | $ | 69,000 | ||||||||||||||||||||||
| Noninterest expense | 17,113,000 | 15,820,000 | 16,598,000 | 17,070,000 | 16,485,000 | |||||||||||||||||||||||||||
| Intersegment noninterest expense | 944,000 | 895,000 | 893,000 | 774,000 | 775,000 | |||||||||||||||||||||||||||
| $ | 18,175,000 | $ | 16,717,000 | $ | 17,486,000 | $ | 17,835,000 | $ | 17,329,000 | |||||||||||||||||||||||
| Pre-tax operating income (loss) | $ | (2,991,000) | $ | (1,686,000) | $ | (2,613,000) | $ | (3,973,000) | $ | (4,203,000) | ||||||||||||||||||||||
| Depreciation expense | 230,000 | 243,000 | 253,000 | 263,000 | 244,000 | |||||||||||||||||||||||||||
| Software amortization expense | 1,196,000 | 1,049,000 | 743,000 | 580,000 | 527,000 | |||||||||||||||||||||||||||
| Intangible amortization expense | 1,551,000 | 1,687,000 | 1,687,000 | 1,687,000 | 1,702,000 | |||||||||||||||||||||||||||
Earnings (losses) before interest, taxes, depreciation, and amortization(1) | $ | (14,000) | $ | 1,293,000 | $ | 70,000 | $ | (1,443,000) | $ | (1,730,000) | ||||||||||||||||||||||
EBITDA Margin(1) | (0.1) | % | 8.6 | % | 0.5 | % | (10.4) | % | (13.2) | % | ||||||||||||||||||||||
| Number of invoices processed | 7,182,044 | 6,788,408 | 6,278,246 | 6,062,779 | 5,717,016 | |||||||||||||||||||||||||||
| Amount of payments processed | $8,777,825,000 | $7,625,735,000 | $7,091,493,000 | $6,687,587,000 | $6,379,680,000 | |||||||||||||||||||||||||||
| Network invoice volume | 719,531 | 567,258 | 661,628 | 701,768 | 621,209 | |||||||||||||||||||||||||||
| Network payment volume | $1,167,464,000 | $922,927,000 | $1,063,228,000 | $1,133,118,000 | $1,035,099,000 | |||||||||||||||||||||||||||
(1)Earnings (losses) before interest, taxes, depreciation, and amortization ("EBITDA") and EBITDA margin are non-GAAP financial measures used as supplemental measures to evaluate the performance of our Payments segment.
22
Deposits summarized as of:
| (Dollars in thousands) | March 31, 2025 | December 31, 2024 | September 30, 2024 | June 30, 2024 | March 31, 2024 | ||||||||||||||||||||||||
| Non-interest bearing demand | $ | 2,260,048 | $ | 1,964,457 | $ | 2,103,092 | $ | 1,689,531 | $ | 1,747,544 | |||||||||||||||||||
| Interest bearing demand | 731,477 | 697,949 | 700,928 | 847,387 | 744,208 | ||||||||||||||||||||||||
| Individual retirement accounts | 42,344 | 43,937 | 46,096 | 48,991 | 50,730 | ||||||||||||||||||||||||
| Money market | 610,120 | 629,610 | 606,321 | 592,667 | 601,685 | ||||||||||||||||||||||||
| Savings | 525,133 | 515,545 | 533,553 | 545,807 | 547,471 | ||||||||||||||||||||||||
| Certificates of deposit | 231,076 | 232,232 | 242,093 | 252,641 | 261,614 | ||||||||||||||||||||||||
| Brokered time deposits | 576,552 | 490,650 | 474,611 | 414,987 | 397,645 | ||||||||||||||||||||||||
| Other brokered deposits | — | 246,440 | — | 7 | 100,066 | ||||||||||||||||||||||||
| Total deposits | $ | 4,976,750 | $ | 4,820,820 | $ | 4,706,694 | $ | 4,392,018 | $ | 4,450,963 | |||||||||||||||||||
23
Net interest margin summarized for the three months ended:
| March 31, 2025 | December 31, 2024 | ||||||||||||||||||||||||||||||||||
| (Dollars in thousands) | Average Balance | Interest | Average Rate(4) | Average Balance | Interest | Average Rate(4) | |||||||||||||||||||||||||||||
| Interest earning assets: | |||||||||||||||||||||||||||||||||||
| Interest earning cash balances | $ | 402,655 | $ | 4,443 | 4.48 | % | $ | 438,177 | $ | 5,299 | 4.81 | % | |||||||||||||||||||||||
| Taxable securities | 379,049 | 5,292 | 5.66 | % | 395,891 | 6,162 | 6.19 | % | |||||||||||||||||||||||||||
| Tax-exempt securities | 2,548 | 16 | 2.55 | % | 2,979 | 20 | 2.67 | % | |||||||||||||||||||||||||||
| FHLB and other restricted stock | 13,958 | 249 | 7.23 | % | 8,008 | 153 | 7.60 | % | |||||||||||||||||||||||||||
Loans(1) | 4,471,710 | 92,270 | 8.37 | % | 4,403,989 | 93,844 | 8.48 | % | |||||||||||||||||||||||||||
| Total interest earning assets | $ | 5,269,920 | $ | 102,270 | 7.87 | % | $ | 5,249,044 | $ | 105,478 | 7.99 | % | |||||||||||||||||||||||
| Non-interest earning assets: | |||||||||||||||||||||||||||||||||||
| Other assets | 724,120 | 717,117 | |||||||||||||||||||||||||||||||||
| Total assets | $ | 5,994,040 | $ | 5,966,161 | |||||||||||||||||||||||||||||||
| Interest bearing liabilities: | |||||||||||||||||||||||||||||||||||
| Deposits: | |||||||||||||||||||||||||||||||||||
| Interest bearing demand | $ | 733,151 | $ | 856 | 0.47 | % | $ | 706,188 | $ | 818 | 0.46 | % | |||||||||||||||||||||||
| Individual retirement accounts | 43,112 | 134 | 1.26 | % | 45,417 | 149 | 1.31 | % | |||||||||||||||||||||||||||
| Money market | 611,244 | 3,880 | 2.57 | % | 637,956 | 4,064 | 2.53 | % | |||||||||||||||||||||||||||
| Savings | 518,690 | 1,367 | 1.07 | % | 522,199 | 1,472 | 1.12 | % | |||||||||||||||||||||||||||
| Certificates of deposit | 231,662 | 1,520 | 2.66 | % | 235,501 | 1,677 | 2.83 | % | |||||||||||||||||||||||||||
| Brokered time deposits | 569,200 | 6,419 | 4.57 | % | 506,090 | 6,201 | 4.87 | % | |||||||||||||||||||||||||||
| Other brokered deposits | 19,899 | 221 | 4.50 | % | 11,919 | 141 | 4.71 | % | |||||||||||||||||||||||||||
| Total interest bearing deposits | 2,726,958 | 14,397 | 2.14 | % | 2,665,270 | 14,522 | 2.17 | % | |||||||||||||||||||||||||||
| Federal Home Loan Bank advances | 164,167 | 1,814 | 4.48 | % | 83,261 | 996 | 4.76 | % | |||||||||||||||||||||||||||
| Subordinated notes | 69,693 | 682 | 3.97 | % | 94,083 | 1,024 | 4.33 | % | |||||||||||||||||||||||||||
| Junior subordinated debentures | 42,431 | 994 | 9.50 | % | 42,268 | 1,129 | 10.63 | % | |||||||||||||||||||||||||||
| Other borrowings | — | — | — | % | 4 | — | — | % | |||||||||||||||||||||||||||
| Total interest bearing liabilities | $ | 3,003,249 | $ | 17,887 | 2.42 | % | $ | 2,884,886 | $ | 17,671 | 2.44 | % | |||||||||||||||||||||||
| Noninterest bearing liabilities and equity: | |||||||||||||||||||||||||||||||||||
| Non-interest bearing demand deposits | 2,005,305 | 2,088,460 | |||||||||||||||||||||||||||||||||
| Other liabilities | 83,226 | 93,850 | |||||||||||||||||||||||||||||||||
| Total equity | 902,260 | 898,965 | |||||||||||||||||||||||||||||||||
| Total liabilities and equity | $ | 5,994,040 | $ | 5,966,161 | |||||||||||||||||||||||||||||||
| Net interest income | $ | 84,383 | $ | 87,807 | |||||||||||||||||||||||||||||||
Interest spread(2) | 5.45 | % | 5.55 | % | |||||||||||||||||||||||||||||||
Net interest margin(3) | 6.49 | % | 6.65 | % | |||||||||||||||||||||||||||||||
(1) Loan balance totals include respective nonaccrual assets.
(2) Net interest spread is the yield on average interest earning assets less the rate on interest bearing liabilities.
(3) Net interest margin is the ratio of net interest income to average interest earning assets.
(4) Average rates have been annualized.
24
Additional information pertaining to our loan portfolio, including loans held for investment and loans held for sale, summarized for the quarters ended:
| (Dollars in thousands) | March 31, 2025 | December 31, 2024 | September 30, 2024 | June 30, 2024 | March 31, 2024 | ||||||||||||||||||||||||
| Average Banking loans | $ | 3,237,692 | $ | 3,163,999 | $ | 3,008,767 | $ | 3,035,612 | $ | 2,932,646 | |||||||||||||||||||
| Average Factoring receivables | 1,060,482 | 1,064,772 | 1,023,570 | 976,087 | 942,414 | ||||||||||||||||||||||||
| Average Payments receivables | 173,536 | 175,218 | 167,969 | 183,970 | 170,306 | ||||||||||||||||||||||||
| Average total loans | $ | 4,471,710 | $ | 4,403,989 | $ | 4,200,306 | $ | 4,195,669 | $ | 4,045,366 | |||||||||||||||||||
| Banking yield | 6.71 | % | 6.60 | % | 6.99 | % | 7.27 | % | 7.34 | % | |||||||||||||||||||
| Factoring yield | 12.75 | % | 13.36 | % | 13.57 | % | 14.14 | % | 13.98 | % | |||||||||||||||||||
| Payments yield | 12.53 | % | 12.71 | % | 13.48 | % | 12.51 | % | 12.18 | % | |||||||||||||||||||
| Total loan yield | 8.37 | % | 8.48 | % | 8.85 | % | 9.10 | % | 9.09 | % | |||||||||||||||||||
Metrics and non-GAAP financial:
| As of and for the Three Months Ended | ||||||||||||||||||||||||||||||||
| (Dollars in thousands, except per share amounts) | March 31, 2025 | December 31, 2024 | September 30, 2024 | June 30, 2024 | March 31, 2024 | |||||||||||||||||||||||||||
| Average total stockholders' equity | $ | 902,260 | $ | 898,965 | $ | 888,435 | $ | 880,227 | $ | 879,825 | ||||||||||||||||||||||
| Average preferred stock liquidation preference | (45,000) | (45,000) | (45,000) | (45,000) | (45,000) | |||||||||||||||||||||||||||
| Average total common stockholders' equity | 857,260 | 853,965 | 843,435 | 835,227 | 834,825 | |||||||||||||||||||||||||||
| Average goodwill and other intangibles | (257,399) | (253,415) | (253,656) | (256,552) | (256,070) | |||||||||||||||||||||||||||
| Average tangible common stockholders' equity | $ | 599,861 | $ | 600,550 | $ | 589,779 | $ | 578,675 | $ | 578,755 | ||||||||||||||||||||||
| Net income available to common stockholders | $ | (784) | $ | 3,036 | $ | 4,546 | $ | 1,945 | $ | 3,357 | ||||||||||||||||||||||
| Average tangible common equity | 599,861 | 600,550 | 589,779 | 578,675 | 578,755 | |||||||||||||||||||||||||||
| Return on average tangible common equity | (0.53 | %) | 2.01 | % | 3.07 | % | 1.35 | % | 2.33 | % | ||||||||||||||||||||||
| Net non-interest expense to average assets ratio: | ||||||||||||||||||||||||||||||||
| Noninterest expenses | $ | 100,173 | $ | 93,275 | $ | 95,646 | $ | 97,343 | $ | 90,371 | ||||||||||||||||||||||
| Noninterest income | $ | 17,190 | $ | 15,751 | $ | 17,497 | $ | 17,167 | $ | 14,999 | ||||||||||||||||||||||
| Net noninterest expenses | $ | 82,983 | $ | 77,524 | $ | 78,149 | $ | 80,176 | $ | 75,372 | ||||||||||||||||||||||
| Average total assets | $ | 5,994,040 | $ | 5,966,161 | $ | 5,871,903 | $ | 5,690,767 | $ | 5,391,520 | ||||||||||||||||||||||
| Net noninterest expense to average assets ratio | 5.61 | % | 5.17 | % | 5.29 | % | 5.67 | % | 5.62 | % | ||||||||||||||||||||||
| Total stockholders' equity | $ | 893,927 | $ | 890,919 | $ | 885,764 | $ | 874,249 | $ | 872,339 | ||||||||||||||||||||||
| Preferred stock liquidation preference | (45,000) | (45,000) | (45,000) | (45,000) | (45,000) | |||||||||||||||||||||||||||
| Total common stockholders' equity | 848,927 | 845,919 | 840,764 | 829,249 | 827,339 | |||||||||||||||||||||||||||
| Goodwill and other intangibles | (255,912) | (258,208) | (251,025) | (254,652) | (257,551) | |||||||||||||||||||||||||||
| Tangible common stockholders' equity | $ | 593,015 | $ | 587,711 | $ | 589,739 | $ | 574,597 | $ | 569,788 | ||||||||||||||||||||||
| Common shares outstanding | 23,419,740 | 23,391,411 | 23,387,522 | 23,353,519 | 23,334,997 | |||||||||||||||||||||||||||
| Tangible book value per share | $ | 25.32 | $ | 25.13 | $ | 25.22 | $ | 24.60 | $ | 24.42 | ||||||||||||||||||||||
| Total assets at end of period | $ | 6,268,394 | $ | 5,948,975 | $ | 5,866,046 | $ | 5,783,334 | $ | 5,575,493 | ||||||||||||||||||||||
| Goodwill and other intangibles | (255,912) | (258,208) | (251,025) | (254,652) | (257,551) | |||||||||||||||||||||||||||
| Tangible assets at period end | $ | 6,012,482 | $ | 5,690,767 | $ | 5,615,021 | $ | 5,528,682 | $ | 5,317,942 | ||||||||||||||||||||||
| Tangible common stockholders' equity ratio | 9.86 | % | 10.33 | % | 10.50 | % | 10.39 | % | 10.71 | % | ||||||||||||||||||||||
1)Triumph Financial uses certain non-GAAP financial measures to provide meaningful supplemental information regarding Triumph Financial's operational performance and to enhance investors' overall understanding of such financial performance. The non-GAAP measures used by Triumph Financial include the following:
•"Tangible common stockholders' equity" is defined as common stockholders' equity less goodwill and other intangible assets.
25
•"Total tangible assets" is defined as total assets less goodwill and other intangible assets.
•"Tangible book value per share" is defined as tangible common stockholders' equity divided by total common shares outstanding. This measure is important to investors interested in changes from period-to-period in book value per share exclusive of changes in intangible assets.
•"Tangible common stockholders' equity ratio" is defined as the ratio of tangible common stockholders' equity divided by total tangible assets. We believe that this measure is important to many investors in the marketplace who are interested in relative changes from period-to period in common equity and total assets, each exclusive of changes in intangible assets.
•"Return on Average Tangible Common Equity" is defined as net income available to common stockholders divided by average tangible common stockholders' equity.
2)Asset quality ratios exclude loans held for sale, except for non-performing assets to total assets.
3)Current quarter ratios are preliminary.
Source: Triumph Financial, Inc.
###
Investor Relations:
Luke Wyse
Senior Vice President, Head of Investor Relations
lwyse@tfin.com
214-365-6936
Media Contact:
Amanda Tavackoli
Senior Vice President, Director of Corporate Communication
atavackoli@tfin.com
214-365-6930
26